Dissertation - HQ
Dissertation - HQ
Dissertation - HQ

Create successful ePaper yourself
Turn your PDF publications into a flip-book with our unique Google optimized e-Paper software.
108 Vertical distribution during ontogeny<br />
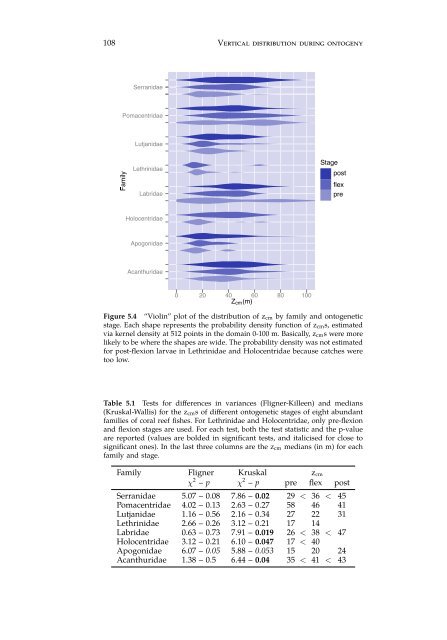
Figure 5.4 “Violin” plot of the distribution of z cm by family and ontogenetic<br />
stage. Each shape represents the probability density function of z cms, estimated<br />
via kernel density at 512 points in the domain 0-100 m. Basically, z cms were more<br />
likely to be where the shapes are wide. The probability density was not estimated<br />
for post-flexion larvae in Lethrinidae and Holocentridae because catches were<br />
too low.<br />
Table 5.1 Tests for differences in variances (Fligner-Killeen) and medians<br />
(Kruskal-Wallis) for the z cms of different ontogenetic stages of eight abundant<br />
families of coral reef fishes. For Lethrinidae and Holocentridae, only pre-flexion<br />
and flexion stages are used. For each test, both the test statistic and the p-value<br />
are reported (values are bolded in significant tests, and italicised for close to<br />
significant ones). In the last three columns are the z cm medians (in m) for each<br />
family and stage.<br />
Family Fligner Kruskal z cm<br />
χ 2 – p χ 2 – p pre flex post<br />
Serranidae 5.07 – 0.08 7.86 – 0.02 29 < 36 < 45<br />
Pomacentridae 4.02 – 0.13 2.63 – 0.27 58 46 41<br />
Lutjanidae 1.16 – 0.56 2.16 – 0.34 27 22 31<br />
Lethrinidae 2.66 – 0.26 3.12 – 0.21 17 14<br />
Labridae 0.63 – 0.73 7.91 – 0.019 26 < 38 < 47<br />
Holocentridae 3.12 – 0.21 6.10 – 0.047 17 < 40<br />
Apogonidae 6.07 – 0.05 5.88 – 0.053 15 20 24<br />
Acanthuridae 1.38 – 0.5 6.44 – 0.04 35 < 41 < 43