Dissertation - HQ
Dissertation - HQ
Dissertation - HQ

You also want an ePaper? Increase the reach of your titles
YUMPU automatically turns print PDFs into web optimized ePapers that Google loves.
Materials and Procedures 53<br />
automatic tracking plugin of ImageJ which outputs coordinates that are<br />
further manipulated in R 149 . Then, magnetic north, which appears as a<br />
white triangle on the compass’ dark background, is also automatically<br />
detected and corrected with the same procedure. Next, the compass<br />
bearings are computed and subtracted from the positions of the larva<br />
represented in polar coordinates relative to the centre of the arena.<br />
At this point, north is consistent and the trajectories are available in<br />
real-world coordinates (centimetres).<br />
Circular statistics treat data as independent unit vectors pointing<br />
toward recorded angles 150 . The sum of these vectors gives information<br />
on directionality in the dataset. If angles are uniformly distributed, all<br />
vectors cancel out and their sum vector is short. Conversely, if some<br />
vectors point in the same direction, the sum vector length is ≫ 0. This<br />
technique removes noise and extracts the information we are interested<br />
in. Therefore, we reduce our data to bearings of vectors between the<br />
centre of the arena and the position of the larva (discarding the length<br />
of such vectors) or swimming directions (discarding swimming speed).<br />
The sum vector is tested for significant directionality for each larva with<br />
Rayleigh’s test. However, while swimming directions are independent<br />
(lags ≥ 1 s shows auto-correlation < 10%), positions are not. A bootstraplike<br />
technique is then used, resampling randomly 5% of the position data.<br />
Rayleigh’s test is computed on the subset of independent data and the<br />
process is repeated 1000 times. Directionality in the dataset is assumed<br />
Statistical analysis<br />
of trajectories<br />
as circular data<br />
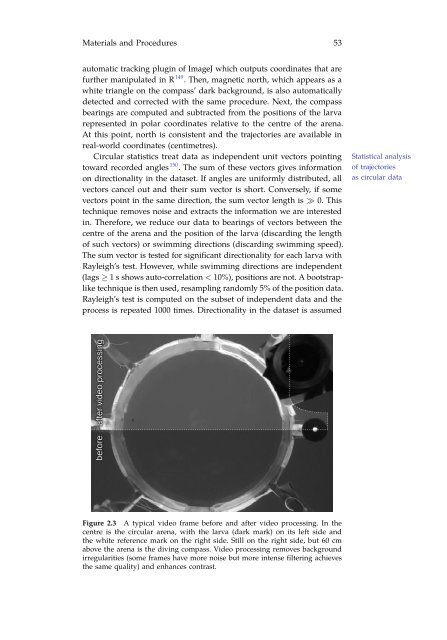
Figure 2.3 A typical video frame before and after video processing. In the<br />
centre is the circular arena, with the larva (dark mark) on its left side and<br />
the white reference mark on the right side. Still on the right side, but 60 cm<br />
above the arena is the diving compass. Video processing removes background<br />
irregularities (some frames have more noise but more intense filtering achieves<br />
the same quality) and enhances contrast.