Dissertation - HQ
Dissertation - HQ
Dissertation - HQ
Create successful ePaper yourself
Turn your PDF publications into a flip-book with our unique Google optimized e-Paper software.
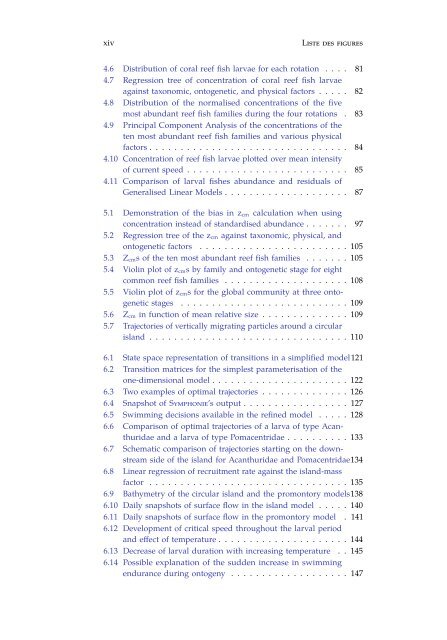
xiv<br />
Liste des figures<br />
4.6 Distribution of coral reef fish larvae for each rotation . . . . 81<br />
4.7 Regression tree of concentration of coral reef fish larvae<br />
against taxonomic, ontogenetic, and physical factors . . . . . 82<br />
4.8 Distribution of the normalised concentrations of the five<br />
most abundant reef fish families during the four rotations . 83<br />
4.9 Principal Component Analysis of the concentrations of the<br />
ten most abundant reef fish families and various physical<br />
factors . . . . . . . . . . . . . . . . . . . . . . . . . . . . . . . . 84<br />
4.10 Concentration of reef fish larvae plotted over mean intensity<br />
of current speed . . . . . . . . . . . . . . . . . . . . . . . . . . 85<br />
4.11 Comparison of larval fishes abundance and residuals of<br />
Generalised Linear Models . . . . . . . . . . . . . . . . . . . . 87<br />
5.1 Demonstration of the bias in z cm calculation when using<br />
concentration instead of standardised abundance . . . . . . . 97<br />
5.2 Regression tree of the z cm against taxonomic, physical, and<br />
ontogenetic factors . . . . . . . . . . . . . . . . . . . . . . . . 105<br />
5.3 Z cms of the ten most abundant reef fish families . . . . . . . 105<br />
5.4 Violin plot of z cms by family and ontogenetic stage for eight<br />
common reef fish families . . . . . . . . . . . . . . . . . . . . 108<br />
5.5 Violin plot of z cms for the global community at three ontogenetic<br />
stages . . . . . . . . . . . . . . . . . . . . . . . . . . . 109<br />
5.6 Z cm in function of mean relative size . . . . . . . . . . . . . . 109<br />
5.7 Trajectories of vertically migrating particles around a circular<br />
island . . . . . . . . . . . . . . . . . . . . . . . . . . . . . . . . 110<br />
6.1 State space representation of transitions in a simplified model121<br />
6.2 Transition matrices for the simplest parameterisation of the<br />
one-dimensional model . . . . . . . . . . . . . . . . . . . . . . 122<br />
6.3 Two examples of optimal trajectories . . . . . . . . . . . . . . 126<br />
6.4 Snapshot of Symphonie’s output . . . . . . . . . . . . . . . . . 127<br />
6.5 Swimming decisions available in the refined model . . . . . 128<br />
6.6 Comparison of optimal trajectories of a larva of type Acanthuridae<br />
and a larva of type Pomacentridae . . . . . . . . . . 133<br />
6.7 Schematic comparison of trajectories starting on the downstream<br />
side of the island for Acanthuridae and Pomacentridae134<br />
6.8 Linear regression of recruitment rate against the island-mass<br />
factor . . . . . . . . . . . . . . . . . . . . . . . . . . . . . . . . 135<br />
6.9 Bathymetry of the circular island and the promontory models138<br />
6.10 Daily snapshots of surface flow in the island model . . . . . 140<br />
6.11 Daily snapshots of surface flow in the promontory model . 141<br />
6.12 Development of critical speed throughout the larval period<br />
and effect of temperature . . . . . . . . . . . . . . . . . . . . . 144<br />
6.13 Decrease of larval duration with increasing temperature . . 145<br />
6.14 Possible explanation of the sudden increase in swimming<br />
endurance during ontogeny . . . . . . . . . . . . . . . . . . . 147


