- Page 1 and 2:
CALIFORNIA ENERGY COMMISSION Final
- Page 3 and 4:
Acknowledgements Jim Braun and Haor
- Page 5 and 6:
Abstract Project 2.1, Fault Detecti
- Page 7 and 8:
TABLE OF CONTENTS LIST OF TABLES LI
- Page 9 and 10:
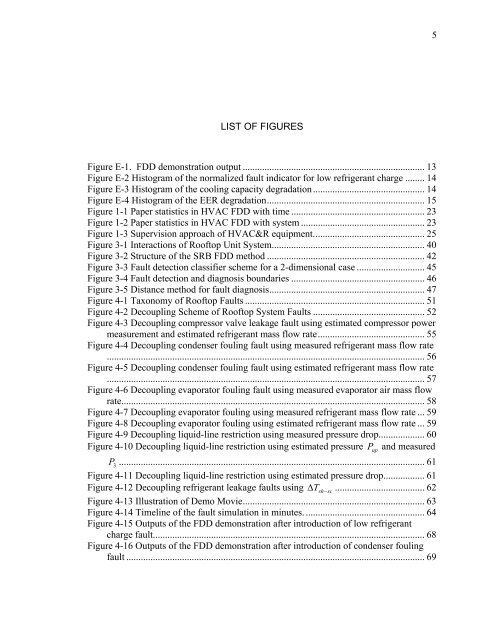
LIST OF FIGURES Page 1 - Field Test
- Page 11 and 12:
The report “Description of Labora
- Page 13 and 14:
mounted heat pumps for heating and
- Page 15 and 16:
The retail stores are in Southern C
- Page 17 and 18:
Figure 1 - Field Test Sites Data Co
- Page 19 and 20:
Gibson School (Cont’d) Woodland S
- Page 21 and 22:
Table 1 - Data List for Modular Sch
- Page 23 and 24:
BUILDING TYPE: Modular School Rooms
- Page 25 and 26:
HEATING / AIR CONDITIONING EQUIPMEN
- Page 27 and 28:
Sacramento Area McDonalds PlayPlace
- Page 29 and 30:
Bradshaw Road (Sacramento Area) McD
- Page 31 and 32:
TEST INSTRUMENTATION: Tables 2 and
- Page 33 and 34:
Table 2 - Data List for Inland Rest
- Page 35 and 36:
Table 3 - Data List for Inland Rest
- Page 37 and 38:
Table 3 - Data List for Inland Rest
- Page 39 and 40:
Castro Valley (San Francisco Bay Ar
- Page 41 and 42:
Castro Valley McDonalds PlayPlace P
- Page 43 and 44:
more or less custom design, publish
- Page 45 and 46:
BUILDING TYPE: Retail Store ADDRESS
- Page 47 and 48:
TEST INSTRUMENTATION: Similar test
- Page 49 and 50:
• Temperature and humidity levels
- Page 51 and 52:
November 2001 - December/January 20
- Page 53 and 54:
Table of Contents 1. Introduction..
- Page 55 and 56:
1. Introduction All the thermodynam
- Page 57 and 58:
Table 1.1 Comparisons of Three Mode
- Page 59 and 60:
solution procedure involves the non
- Page 61 and 62:
independent of the moisture content
- Page 63 and 64:
function, f ( X , y) , if it can be
- Page 65 and 66:
Figure 2.1 Neural-Network Implement
- Page 67 and 68:
prototype was developed by using th
- Page 69 and 70:
3. Comparison of black-box modeling
- Page 71 and 72:
which is more accurate than the exp
- Page 73 and 74:
Similar to GRNN, RBF has very good
- Page 75 and 76:
Table 3.2 RMS error (Polynomial,GRN
- Page 77 and 78:
Table 3.4 Contrast of Black-box mod
- Page 79 and 80:
Polynomial plus GRNN Training Desir
- Page 81 and 82:
interpolation(poly+GRNN) extrapolat
- Page 83 and 84:
used to build the steady-state mode
- Page 85 and 86:
α , ρ, τ I t t s h o A t a Figur
- Page 87 and 88:
Temperature (F) 82 79 76 73 Condens
- Page 89 and 90:
0.050 0.045 Pressure = 101.3 [kPa]
- Page 91 and 92:
T T − T − T W = W −W −W m =
- Page 93 and 94:
Figure 4.8 Output of three steady-s
- Page 95 and 96:
will be calculated to represent the
- Page 97 and 98:
180 175 RMS error = 0.3984 (F) Pred
- Page 99 and 100:
180 175 RMS error =1.1472 (F) Predi
- Page 101 and 102:
51 50 RMS error=0.3860 (F) Predicte
- Page 103 and 104:
4.4 California field site results S
- Page 105 and 106:
105 100 RMS error =0.5982 (F) Predi
- Page 107 and 108:
Since air conditioners always cycle
- Page 109 and 110:
6. Conclusions and future work So f
- Page 111 and 112:
Lee, W., House, J.M. and Shin, D.R.
- Page 113 and 114:
Table of Contents 1 Introduction...
- Page 115 and 116:
AHU α β 2 d i EER ∆ ∆ η v T
- Page 117 and 118:
$ !! !! )
- Page 119 and 120:
Paper statistics in HVAC FDD Number
- Page 121 and 122:
011>" - , ?" 8?"
- Page 123 and 124:
+ : 6336" ,
- Page 125 and 126:
+ :: !!- :: !!
- Page 127 and 128:
6 24 122 7) 6 3++, ) . !! /011
- Page 129 and 130:
)
- Page 131 and 132:
336 F / s $ S
- Page 133 and 134:
N $ V v1
- Page 135 and 136:
Figure 3-4 2-dimensional residual d
- Page 137 and 138:
10 5 Normal and current operation p
- Page 139 and 140:
7 N Ω f N N Ω = Ω X ,
- Page 141 and 142:
0 + α 6 d χ ( )
- Page 143 and 144:
Normal operation region Residual-2
- Page 145 and 146:
Table 3-2 Refrigerant Leak at 20% l
- Page 147 and 148:
ratio dist = P F 1 P F 1 2 1 9.0
- Page 149 and 150:
$ , " - (
- Page 151 and 152:
)(( 0( 04 ) 6330" /
- Page 153:
Table 4-2 Polynomial plus GRNN mode
- Page 157 and 158:
4.2 m r,predict (kg/min) 4 3.8 3.6
- Page 159 and 160:
6 1)( ( ( 6 1)( ) , ( )
- Page 161 and 162:
- )
- Page 163 and 164:
? "J> *"J060 #"J083 *$"J670 #"J08<
- Page 165 and 166:
Table 4-17 Detected (normal, fault)
- Page 167 and 168:
c=1 c=10 c=20 1 0.8 Distance ratio
- Page 169 and 170:
$ /) $ 0111" .. !!
- Page 171 and 172:
Chen, Bin and Braun, J.E, 2000. Sim
- Page 173 and 174:
Ventilating, Air-Conditioning and R
- Page 175 and 176:
1.T amb 2.T ra 3.RH ra Plant Prepro
- Page 177 and 178:
F) $
- Page 179 and 180:
+: + $ 5
- Page 181 and 182:
.44(' * 5 09( ( 0( F N ( M , Σ)
- Page 183 and 184:
Load 20% 40% 60% 80% 100% 3 4 Fault
- Page 185 and 186:
Load 20% 40% 60% 80% 100% 3 4 Fault
- Page 187 and 188:
3 4 0 0 0 0 0.4173 0 0.0010 0 0.000
- Page 189 and 190:
.44(' $ () ) ) - $
- Page 191 and 192:
∆P Restrictio n Level=100%* ∆P
- Page 193 and 194:
2 TABLE OF CONTENTS TABLE OF CONTEN
- Page 195 and 196:
4 A1.2.3 Valve Position Expression
- Page 197 and 198:
6 Figure 2-10 Decoupling refrigeran
- Page 199 and 200:
8 LIST OF TABLES Table 1-1 Fault di
- Page 201 and 202:
10 N = Number of generated sample p
- Page 203 and 204:
12 with a fixed-orifice as the expa
- Page 205 and 206:
14 (residuals) should have a zero m
- Page 207 and 208:
16 expected distribution of the res
- Page 209 and 210:
18 operation. Another advantage is
- Page 211 and 212:
20 1.1.2.1 Original SRB Fault Diagn
- Page 213 and 214:
22 Corresponding to the SRB fault d
- Page 215 and 216:
24 integration of the probability d
- Page 217 and 218:
26 1. Simplifies fault detection fr
- Page 219 and 220:
28 Step i Do FDD on fault i . After
- Page 221 and 222:
30 ROOFTOP UNIT FAULTS COMPONENT-LE
- Page 223 and 224:
32 has two possible causes: refrige
- Page 225 and 226:
34 1.2.3 Decoupling of Component Fa
- Page 227 and 228:
36 1.2.3.2 Condenser-Related Faults
- Page 229 and 230:
38 mixture, χ ref is known as the
- Page 231 and 232:
40 Table 1-3 also lists the refrige
- Page 233 and 234:
42 Refrigerant Property T cond, pre
- Page 235 and 236:
44 as an independent feature only f
- Page 237 and 238:
46 evaporator air flow rate reducti
- Page 239 and 240:
48 5. 2 Pll ∆ deviates drasticall
- Page 241 and 242:
50 System-Level Faults RefUnder Ref
- Page 243 and 244:
52 1.2.5 Summary of Decoupling Sche
- Page 245 and 246:
54 noise, system disturbances and m
- Page 247 and 248:
56 compressor data. When there is a
- Page 249 and 250:
58 Figure 2-5 Decoupling evaporator
- Page 251 and 252:
60 Total Pressure Drop of Liquid- L
- Page 253 and 254:
62 Figure 2-11 Illustration of Demo
- Page 255 and 256:
64 bypass the compressor. At this t
- Page 257 and 258: 66 for T dis because there is no ov
- Page 259 and 260: 68 Figure 2-14 Outputs of the FDD d
- Page 261 and 262: 70 the system requires more refrige
- Page 263 and 264: 72 recommended that: the system req
- Page 265 and 266: 74 Figure 2-20 Outputs of the FDD d
- Page 267 and 268: 76 Figure 2-21 Histogram bar plot o
- Page 269 and 270: 78 Figure 2-24 Histogram bar plot o
- Page 271 and 272: 80 Figure 2-27 Histogram bar plot o
- Page 273 and 274: 82 2.3.2 Summarized Results for Oth
- Page 275 and 276: 84 3 CONCLUSIONS AND RECOMMENDATION
- Page 277 and 278: 86 Breuker, M.S. and Braun, J. E.,
- Page 279 and 280: 88 Lee, W., House, J.M. and Shin, D
- Page 281 and 282: 90 APPENDIX 1 PHYSICAL MODELS OF EX
- Page 283 and 284: 92 A1.1.2 Short-Tube Models Many re
- Page 285 and 286: 94 m& = CA ρ P up − P ) (A1-5) (
- Page 287 and 288: 96 The abrupt change of CA for the
- Page 289 and 290: 98 These equations can be combined
- Page 291 and 292: 100 H h T sh , max opening T sh , s
- Page 293 and 294: 102 A1.2.5 Parameter Estimation Met
- Page 295 and 296: 104 T (2 T sh, ratingopening , sh,m
- Page 297 and 298: 106 Harms’Result Harms plotted al
- Page 299 and 300: 108 Mass flow rate Local linearizat
- Page 301 and 302: 110 temperature on the RTD is unifo
- Page 303 and 304: 112 in cold water application, it i
- Page 305 and 306: 1 ACKNOWLEDGEMENTS The research tha
- Page 307: 3 2.2.3 Todd Harms’ Data ........
- Page 311 and 312: 7 LIST OF TABLES Table E-1 FDD resu
- Page 313 and 314: 9 IA = Independence Assumption λ i
- Page 315 and 316: 11 EXECUTIVE SUMMARY Packaged air c
- Page 317 and 318: 13 current values of the fault indi
- Page 319 and 320: 15 Figure E-4 Histogram of the EER
- Page 321 and 322: 17 2. Operational cost savings, whi
- Page 323 and 324: 19 Table E-5 Conservative Lifetime
- Page 325 and 326: 21 constraints. Economic constraint
- Page 327 and 328: 23 Paper statistics in HVAC FDD 35
- Page 329 and 330: 25 on directional changes to identi
- Page 331 and 332: 27 fault levels at different operat
- Page 333 and 334: 29 was concluded that the method wa
- Page 335 and 336: 31 However, several improvements ar
- Page 337 and 338: 33 point sensor placement is genera
- Page 339 and 340: 35 2 DATA SOURCES USED FOR EVALUATI
- Page 341 and 342: 37 The fives types of faults are re
- Page 343 and 344: 39 Occupation Type Climate Location
- Page 345 and 346: 41 The SRB FDD method determines wh
- Page 347 and 348: 43 The following sections describe
- Page 349 and 350: 45 points rather than on a distribu
- Page 351 and 352: 47 current operation point P 1, P F
- Page 353 and 354: 49 4 A DECOUPLING-BASED FDD TECHNIQ
- Page 355 and 356: 51 This approach overcomes the draw
- Page 357 and 358: 53 ⎡ ∆T ⎢ ⎢ ∆T 2 ⎢ ∆
- Page 359 and 360:
55 improving the compressor model p
- Page 361 and 362:
57 Condenser Air Mass Flow Rate (lb
- Page 363 and 364:
59 Evaporator Air Mass Flow Rate (l
- Page 365 and 366:
61 Liquid-Line Pressure Drop (PSI)
- Page 367 and 368:
63 4.2.2 Purdue Field Emulation Sit
- Page 369 and 370:
65 1. Evacuated the system, and the
- Page 371 and 372:
67 normal _ value − current _ val
- Page 373 and 374:
69 Figure 4-16 shows one frame afte
- Page 375 and 376:
71 Figure 4-18 shows one frame afte
- Page 377 and 378:
73 valve position can be seen from
- Page 379 and 380:
Figure 4-22 Outputs of the FDD demo
- Page 381 and 382:
77 Figure 4-23 Histogram bar plot o
- Page 383 and 384:
79 Figure 4-26 Histogram bar plot o
- Page 385 and 386:
81 Figure 4-29 Histogram bar plot o
- Page 387 and 388:
83 4.2.3.2 Summarized Results for O
- Page 389 and 390:
85 5 ECONOMIC ASSESSMENTS Since the
- Page 391 and 392:
87 inspection savings would be $2,0
- Page 393 and 394:
89 Q & Cap = W & × EER (5-2) The e
- Page 395 and 396:
91 4. electricity costs ( C e ). Ut
- Page 397 and 398:
93 Table 5-3 lists estimates of equ
- Page 399 and 400:
95 5.4 Smart Service Schedule Savin
- Page 401 and 402:
97 7. A 6-ton RTU having a cost of
- Page 403 and 404:
99 Location North California South
- Page 405 and 406:
101 5. Three case studies were inve
- Page 407 and 408:
103 REFERENCES Aaron, D. A., and P.
- Page 409 and 410:
105 Davis, Coby. 1993. Comparison o
- Page 411:
107 Rossi, T.M., 1995. Detection, D