- Page 2 and 3: Disclaimer This presentation and th
- Page 4 and 5: Dexia 2014: A Retail Group with 10
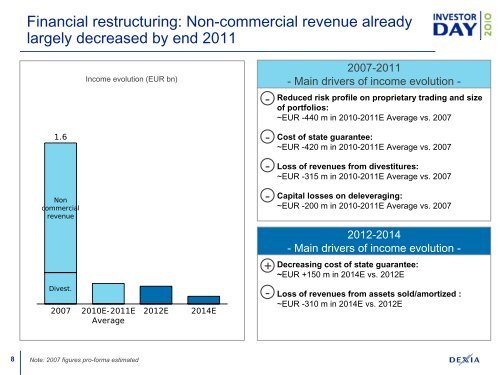
- Page 6 and 7: Financial restructuring: Scaled dow
- Page 10 and 11: Capturing Retail upside in a fast g
- Page 12 and 13: Dexia teams sharing clear strategic
- Page 14 and 15: Investor Day 2010 - Agenda 11h00 -
- Page 16 and 17: Economic scenario: Slow recovery in
- Page 18 and 19: Dexia 2014: Key drivers of balance
- Page 20 and 21: LT wholesale funding program aligne
- Page 22 and 23: Significant improvement of Group sh
- Page 24 and 25: Target 2014: Stringent management o
- Page 26 and 27: Target 2014: Strong rebound of Dexi
- Page 28 and 29: New capital regulations: Basel III
- Page 30 and 31: New liquidity regime: Getting prepa
- Page 32 and 33: Legacy division Deleverage balance
- Page 34 and 35: Sustained pace of asset sales in 20
- Page 36 and 37: Dedicated set up in place to manage
- Page 38 and 39: Bond portfolio in run-off (EUR bn)
- Page 40 and 41: Financial Products portfolio Financ
- Page 42 and 43: After 2014: Ability to hold and man
- Page 44 and 45: Financials: Progressive decrease in
- Page 46 and 47: Public and Wholesale Banking Renew
- Page 48 and 49: PWB 2014: Renew with sustainable sc
- Page 50 and 51: Our ambition: Renew with sustainabl
- Page 52 and 53: Public Banking Belgium 2010: Qualit
- Page 54 and 55: Public Banking Belgium 2010: Contin
- Page 56 and 57: Public Banking France 2010: Quality
- Page 58 and 59:
Public Banking France 2010: A recog
- Page 60 and 61:
Corporate Banking Belgium 2010: Ree
- Page 62 and 63:
Project Finance 2010: A well recogn
- Page 64 and 65:
PWB Target 2014: Renew with sustain
- Page 66 and 67:
PWB target 2014 Public Banking Bel
- Page 68 and 69:
Belgium and Luxembourg: Wealthy and
- Page 70 and 71:
Belgium: A concentrated and mature
- Page 72 and 73:
Strong Retail position with full te
- Page 74 and 75:
A resilient and solid franchise thr
- Page 76 and 77:
Our ambition: Unlock growth potenti
- Page 78 and 79:
Commercial targets in network to gr
- Page 80 and 81:
EUR 350 m Capex investment plan lau
- Page 82 and 83:
Roll-out of Open Branch Concept on
- Page 84 and 85:
A new in-branch specialized sales &
- Page 86 and 87:
Branch re-clustering and optimizing
- Page 88 and 89:
Launch of innovative offers to supp
- Page 90 and 91:
Operating efficiency under close sc
- Page 92 and 93:
RCB Luxembourg Consolidate local fr
- Page 94 and 95:
Dexia: A major actor in Luxembourg
- Page 96 and 97:
A domestic and international Privat
- Page 98 and 99:
By 2014: Increase market share in R
- Page 100 and 101:
By 2014: Reinforce Private Banking
- Page 102 and 103:
By 2014: Further improve cost effic
- Page 104 and 105:
RCB Belgium and Luxembourg Enhance
- Page 106 and 107:
Asset Management & Services Manage
- Page 108 and 109:
Asset Management An efficient and r
- Page 110 and 111:
Resilience proven through the crisi
- Page 112 and 113:
A client-centric business model, ad
- Page 114 and 115:
Dexia AM Target 2014: Deliver furth
- Page 116 and 117:
DIS: A key insurance player with a
- Page 118 and 119:
Going forward, Dexia Insurance to d
- Page 120 and 121:
DVV: Investment plan to develop tie
- Page 122 and 123:
Investor Services A well recognized
- Page 124 and 125:
Recent industry trends creating bot
- Page 126 and 127:
RBC Dexia Investor Services is well
- Page 128 and 129:
Investor Services Target 2014: Deli
- Page 130 and 131:
In a nutshell: DenizBank, a sustain
- Page 132 and 133:
Several socio-economic indicators c
- Page 134 and 135:
Current level of banking penetratio
- Page 136 and 137:
DenizBank, the most influential pro
- Page 138 and 139:
DenizBank growth outperformed the m
- Page 140 and 141:
Accelerated branch opening over the
- Page 142 and 143:
Strong Commercial and Corporate seg
- Page 144 and 145:
Deniz 2014: Be the first alternativ
- Page 146 and 147:
Network: DenizBank to open 300+ new
- Page 148 and 149:
SME & Agricultural Banking: DenizBa
- Page 150 and 151:
Overall: Increased weight of Retail
- Page 152 and 153:
Operating model Reach operational e
- Page 154 and 155:
Reaching operational excellence fac
- Page 156 and 157:
Efficiency measures 2008-2011: Capt
- Page 158 and 159:
Industrialisation 2008-2011: Manage
- Page 160 and 161:
Examples of intra-group efficiency
- Page 162 and 163:
Close monitoring system in place St
- Page 164 and 165:
Dexia Group Dexia 2014: A Retail Gr
- Page 166 and 167:
166
- Page 168 and 169:
Philippe Rucheton Philippe Rucheton
- Page 170 and 171:
Stefaan Decraene The first part of
- Page 172:
André Vanden Camp André Vanden Ca