Full Report - Subregional Office for East and North-East Asia - escap
Full Report - Subregional Office for East and North-East Asia - escap
Full Report - Subregional Office for East and North-East Asia - escap
You also want an ePaper? Increase the reach of your titles
YUMPU automatically turns print PDFs into web optimized ePapers that Google loves.
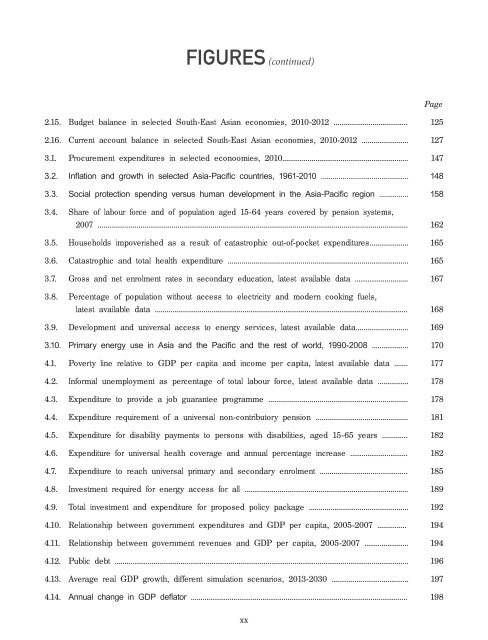
FIGURES (continued)<br />
Page<br />
2.15. Budget balance in selected South-<strong>East</strong> <strong>Asia</strong>n economies, 2010-2012 ...................................... 125<br />
2.16. Current account balance in selected South-<strong>East</strong> <strong>Asia</strong>n economies, 2010-2012 ........................ 127<br />
3.1. Procurement expenditures in selected econoomies, 2010................................................................. 147<br />
3.2. Inflation <strong>and</strong> growth in selected <strong>Asia</strong>-Pacific countries, 1961-2010 ............................................. 148<br />
3.3. Social protection spending versus human development in the <strong>Asia</strong>-Pacific region ............... 158<br />
3.4. Share of labour <strong>for</strong>ce <strong>and</strong> of population aged 15-64 years covered by pension systems,<br />
2007 ............................................................................................................................................................... 162<br />
3.5. Households impoverished as a result of catastrophic out-of-pocket expenditures.................... 165<br />
3.6. Catastrophic <strong>and</strong> total health expenditure ............................................................................................ 165<br />
3.7. Gross <strong>and</strong> net enrolment rates in secondary education, latest available data ............................ 167<br />
3.8. Percentage of population without access to electricity <strong>and</strong> modern cooking fuels,<br />
latest available data .................................................................................................................................. 168<br />
3.9. Development <strong>and</strong> universal access to energy services, latest available data........................... 169<br />
3.10. Primary energy use in <strong>Asia</strong> <strong>and</strong> the Pacific <strong>and</strong> the rest of world, 1990-2008 ................... 170<br />
4.1. Poverty line relative to GDP per capita <strong>and</strong> income per capita, latest available data ....... 177<br />
4.2. In<strong>for</strong>mal unemployment as percentage of total labour <strong>for</strong>ce, latest available data ................ 178<br />
4.3. Expenditure to provide a job guarantee programme ....................................................................... 178<br />
4.4. Expenditure requirement of a universal non-contributory pension ............................................... 181<br />
4.5. Expenditure <strong>for</strong> disability payments to persons with disabilities, aged 15-65 years ............. 182<br />
4.6. Expenditure <strong>for</strong> universal health coverage <strong>and</strong> annual percentage increase .............................. 182<br />
4.7. Expenditure to reach universal primary <strong>and</strong> secondary enrolment ............................................. 185<br />
4.8. Investment required <strong>for</strong> energy access <strong>for</strong> all .................................................................................... 189<br />
4.9. Total investment <strong>and</strong> expenditure <strong>for</strong> proposed policy package ................................................... 192<br />
4.10. Relationship between government expenditures <strong>and</strong> GDP per capita, 2005-2007 ............... 194<br />
4.11. Relationship between government revenues <strong>and</strong> GDP per capita, 2005-2007 ....................... 194<br />
4.12. Public debt ........................................................................................................................................................ 196<br />
4.13. Average real GDP growth, different simulation scenarios, 2013-2030 ........................................ 197<br />
4.14. Annual change in GDP deflator ................................................................................................................ 198<br />
xx


