

Full Report - Subregional Office for East and North-East Asia - escap
Full Report - Subregional Office for East and North-East Asia - escap
Full Report - Subregional Office for East and North-East Asia - escap

You also want an ePaper? Increase the reach of your titles
YUMPU automatically turns print PDFs into web optimized ePapers that Google loves.
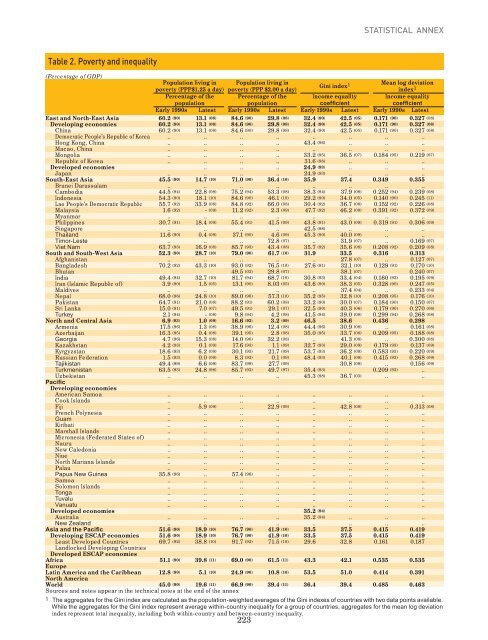
STATISTICAL ANNEX<br />
Table 2. Poverty <strong>and</strong> inequality<br />
(Percentage of GDP)<br />
Population living in Population living in<br />
Gini index<br />
poverty (PPP$1.25 a day) poverty (PPP $2.00 a day)<br />
Mean log deviation<br />
index 1<br />
Percentage of the<br />
population<br />
Percentage of the<br />
population<br />
Income equality<br />
coefficient<br />
Income equality<br />
coefficient<br />
Early 1990s Latest Early 1990s Latest Early 1990s Latest Early 1990s Latest<br />
<strong>East</strong> <strong>and</strong> <strong>North</strong>-<strong>East</strong> <strong>Asia</strong> 60.2 (90) 13.1 (08) 84.6 (90) 29.8 (08) 32.4 (90) 42.5 (05) 0.171 (90) 0.327 (08)<br />
Developing economies 60.2 (90) 13.1 (08) 84.6 (90) 29.8 (08) 32.4 (90) 42.5 (05) 0.171 (90) 0.327 (08)<br />
China 60.2 (90) 13.1 (08) 84.6 (90) 29.8 (08) 32.4 (90) 42.5 (05) 0.171 (90) 0.327 (08)<br />
Democratic People’s Republic of Korea .. .. .. .. .. .. .. ..<br />
Hong Kong, China .. .. .. .. 43.4 (96) .. .. ..<br />
Macao, China .. .. .. .. .. .. .. ..<br />
Mongolia .. .. .. .. 33.2 (95) 36.5 (07) 0.184 (95) 0.219 (07)<br />
Republic of Korea .. .. .. .. 31.6 (98) .. .. ..<br />
Developed economies .. .. .. 24.9 (93) .. .. ..<br />
Japan .. .. .. .. 24.9 (93) .. .. ..<br />
South-<strong>East</strong> <strong>Asia</strong> 45.5 (90) 14.7 (10) 71.0 (90) 36.4 (10) 35.9 37.4 0.349 0.355<br />
Brunei Darussalam .. .. .. .. .. .. .. ..<br />
Cambodia 44.5 (94) 22.8 (08) 75.2 (94) 53.3 (08) 38.3 (94) 37.9 (08) 0.252 (94) 0.239 (08)<br />
Indonesia 54.3 (90) 18.1 (10) 84.6 (90) 46.1 (10) 29.2 (90) 34.0 (05) 0.140 (90) 0.245 (11)<br />
Lao People’s Democratic Republic 55.7 (92) 33.9 (08) 84.8 (92) 66.0 (08) 30.4 (92) 36.7 (08) 0.152 (92) 0.226 (08)<br />
Malaysia 1.6 (92) - (09) 11.2 (92) 2.3 (09) 47.7 (92) 46.2 (09) 0.391 (92) 0.372 (09)<br />
Myanmar .. .. .. .. .. .. .. ..<br />
Philippines 30.7 (91) 18.4 (09) 55.4 (91) 41.5 (09) 43.8 (91) 43.0 (09) 0.319 (91) 0.306 (09)<br />
Singapore .. .. .. .. 42.5 (98) .. .. ..<br />
Thail<strong>and</strong> 11.6 (90) 0.4 (09) 37.1 (90) 4.6 (09) 45.3 (90) 40.0 (09) .. ..<br />
Timor-Leste .. .. .. 72.8 (07) .. 31.9 (07) .. 0.169 (07)<br />
Viet Nam 63.7 (93) 16.9 (08) 85.7 (93) 43.4 (08) 35.7 (92) 35.6 (08) 0.208 (92) 0.209 (08)<br />
South <strong>and</strong> South-West <strong>Asia</strong> 52.3 (90) 28.7 (10) 79.0 (90) 61.7 (10) 31.9 33.5 0.316 0.313<br />
Afghanistan .. .. .. .. .. 27.8 (07) .. 0.127 (07)<br />
Bangladesh 70.2 (92) 43.3 (10) 93.0 (92) 76.5 (10) 27.6 (91) 32.1 (10) 0.129 (91) 0.170 (10)<br />
Bhutan 49.5 (03) 29.8 (07) 38.1 (07) 0.240 (07)<br />
India 49.4 (94) 32.7 (10) 81.7 (94) 68.7 (10) 30.8 (93) 33.4 (04) 0.160 (93) 0.195 (09)<br />
Iran (Islamic Republic of) 3.9 (90) 1.5 (05) 13.1 (90) 8.03 (05) 43.6 (90) 38.3 (05) 0.328 (90) 0.247 (05)<br />
Maldives .. .. .. .. .. 37.4 (04) .. 0.233 (04)<br />
Nepal 68.0 (96) 24.8 (10) 89.0 (96) 57.3 (10) 35.2 (95) 32.8 (10) 0.208 (95) 0.176 (10)<br />
Pakistan 64.7 (91) 21.0 (08) 88.2 (91) 60.2 (08) 33.2 (90) 30.0 (07) 0.184 (90) 0.150 (07)<br />
Sri Lanka 15.0 (91) 7.0 (07) 49.5 (91) 29.1 (07) 32.5 (90) 40.3 (06) 0.179 (90) 0.270 (06)<br />
Turkey 2.1 (94) - (08) 9.8 (94) 4.2 (08) 41.5 (94) 39.0 (08) 0.299 (94) 0.268 (08)<br />
<strong>North</strong> <strong>and</strong> Central <strong>Asia</strong> 6.9 (93) 1.0 (09) 16.6 (93) 3.2 (09) 46.5 38.6 0.436 0.298<br />
Armenia 17.5 (96) 1.3 (08) 38.9 (96) 12.4 (08) 44.4 (96) 30.9 (08) .. 0.161 (08)<br />
Azerbaijan 16.3 (95) 0.4 (08) 39.1 (95) 2.8 (08) 35.0 (95) 33.7 (08) 0.209 (95) 0.188 (08)<br />
Georgia 4.7 (96) 15.3 (08) 14.0 (96) 32.2 (08) .. 41.3 (08) .. 0.300 (08)<br />
Kazakhstan 4.2 (93) 0.1 (09) 17.6 (93) 1.1 (09) 32.7 (93) 29.0 (09) 0.179 (93) 0.137 (09)<br />
Kyrgyzstan 18.6 (93) 6.2 (09) 30.1 (93) 21.7 (09) 53.7 (93) 36.2 (09) 0.583 (93) 0.220 (09)<br />
Russian Federation 1.5 (93) 0.0 (09) 8.3 (93) 0.1 (09) 48.4 (93) 40.1 (09) 0.415 (93) 0.268 (09)<br />
Tajikistan 49.4 (99) 6.6 (09) 83.7 (99) 27.7 (09) 30.8 (09) .. 0.156 (09)<br />
Turkmenistan 63.5 (93) 24.8 (98) 85.7 (93) 49.7 (97) 35.4 (93) 0.209 (93) ..<br />
Uzbekistan .. .. .. .. 45.3 (98) 36.7 (03) .. ..<br />
Pacific<br />
Developing economies<br />
American Samoa .. .. .. .. .. .. .. ..<br />
Cook Isl<strong>and</strong>s .. .. .. .. .. .. .. ..<br />
Fiji .. 5.9 (09) .. 22.9 (09) .. 42.8 (08) .. 0.313 (08)<br />
French Polynesia .. .. .. .. .. .. .. ..<br />
Guam .. .. .. .. .. .. .. ..<br />
Kiribati .. .. .. .. .. .. .. ..<br />
Marshall Isl<strong>and</strong>s .. .. .. .. .. .. .. ..<br />
Micronesia (Federated States of) .. .. .. .. .. .. .. ..<br />
Nauru .. .. .. .. .. .. .. ..<br />
New Caledonia .. .. .. .. .. .. .. ..<br />
Niue .. .. .. .. .. .. .. ..<br />
<strong>North</strong> Mariana Isl<strong>and</strong>s .. .. .. .. .. .. .. ..<br />
Palau .. .. .. .. .. .. .. ..<br />
Papua New Guinea 35.8 (96) .. 57.4 (96) .. .. .. .. ..<br />
Samoa .. .. .. .. .. .. .. ..<br />
Solomon Isl<strong>and</strong>s .. .. .. .. .. .. .. ..<br />
Tonga .. .. .. .. .. .. .. ..<br />
Tuvalu .. .. .. .. .. .. .. ..<br />
Vanuatu .. .. .. .. .. .. .. ..<br />
Developed economies 35.2 (94)<br />
Australia .. .. .. .. 35.2 (94) .. .. ..<br />
New Zeal<strong>and</strong> .. .. .. .. .. .. .. ..<br />
<strong>Asia</strong> <strong>and</strong> the Pacific 51.6 (90) 18.9 (10) 76.7 (90) 41.9 (10) 33.5 37.5 0.415 0.419<br />
Developing ESCAP economies 51.6 (90) 18.9 (10) 76.7 (90) 41.9 (10) 33.5 37.5 0.415 0.419<br />
Least Developed Countries 69.7 (92) 38.8 (10) 91.7 (92) 71.5 (10) 29.6 32.8 0.161 0.187<br />
L<strong>and</strong>locked Developing Countries<br />
Developed ESCAP economies<br />
Africa 51.1 (90) 39.8 (11) 69.0 (90) 61.5 (11) 43.3 42.1 0.535 0.535<br />
Europe<br />
Latin America <strong>and</strong> the Caribbean 12.8 (90) 5.1 (10) 24.9 (90) 10.8 (10) 53.5 51.0 0.414 0.391<br />
<strong>North</strong> America<br />
World 45.0 (90) 19.6 (11) 66.9 (90) 39.4 (11) 36.4 39.4 0.485 0.463<br />
Sources <strong>and</strong> notes appear in the technical notes at the end of the annex<br />
1 The aggregates <strong>for</strong> the Gini index are calculated as the population-weighted averages of the Gini indexes of countries with two data points available.<br />
While the aggregates <strong>for</strong> the Gini index represent average within-country inequality <strong>for</strong> a group of countries, aggregates <strong>for</strong> the mean log deviation<br />
index represent total inequality, including both within-country <strong>and</strong> between-country inequality.<br />
223


