

Full Report - Subregional Office for East and North-East Asia - escap
Full Report - Subregional Office for East and North-East Asia - escap
Full Report - Subregional Office for East and North-East Asia - escap

Create successful ePaper yourself
Turn your PDF publications into a flip-book with our unique Google optimized e-Paper software.
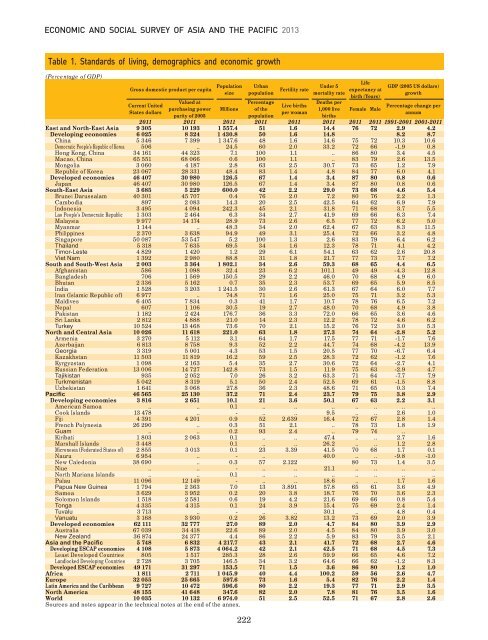
ECONOMIC AND SOCIAL SURVEY OF ASIA AND THE PACIFIC 2013<br />
Table 1. St<strong>and</strong>ards of living, demographics <strong>and</strong> economic growth<br />
(Percentage of GDP)<br />
Gross domestic product per capita<br />
Current United<br />
States dollars<br />
Valued at<br />
purchasing power<br />
parity of 2005<br />
Population<br />
size<br />
Millions<br />
222<br />
Urban<br />
population<br />
Percentage<br />
of the<br />
population<br />
Fertility rate<br />
Live births<br />
per woman<br />
Under 5<br />
mortality rate<br />
Deaths per<br />
1,000 live<br />
births<br />
Life<br />
expectancy at<br />
birth (Years)<br />
Female Male<br />
GDP (2005 US dollars)<br />
growth<br />
Percentage change per<br />
annum<br />
2011 2011 2011 2011 2011 2011 2011 2011 1991-2001 2001-2011<br />
<strong>East</strong> <strong>and</strong> <strong>North</strong>-<strong>East</strong> <strong>Asia</strong> 9 305 10 193 1 557.4 51 1.6 14.4 76 72 2.9 4.2<br />
Developing economies 6 025 8 324 1 430.8 50 1.6 14.8 8.2 8.7<br />
China 5 346 7 399 1 347.6 48 1.6 14.6 75 72 10.3 10.6<br />
Democratic People’s Republic of Korea 506 .. 24.5 60 2.0 33.2 72 66 -1.9 0.8<br />
Hong Kong, China 34 161 44 323 7.1 100 1.1 .. 86 80 3.4 4.5<br />
Macao, China 65 551 68 066 0.6 100 1.1 .. 83 79 2.6 13.5<br />
Mongolia 3 060 4 187 2.8 63 2.5 30.7 73 65 1.2 7.9<br />
Republic of Korea 23 067 28 331 48.4 83 1.4 4.8 84 77 6.0 4.1<br />
Developed economies 46 407 30 980 126.5 67 1.4 3.4 87 80 0.8 0.6<br />
Japan 46 407 30 980 126.5 67 1.4 3.4 87 80 0.8 0.6<br />
South-<strong>East</strong> <strong>Asia</strong> 3 685 5 229 600.0 42 2.2 29.0 73 68 4.6 5.4<br />
Brunei Darussalam 40 301 45 707 0.4 76 2.0 7.2 80 76 2.2 1.3<br />
Cambodia 897 2 083 14.3 20 2.5 42.5 64 62 6.9 7.9<br />
Indonesia 3 495 4 094 242.3 45 2.1 31.8 71 68 3.7 5.5<br />
Lao People’s Democratic Republic 1 303 2 464 6.3 34 2.7 41.9 69 66 6.3 7.4<br />
Malaysia 9 977 14 174 28.9 73 2.6 6.5 77 72 6.2 5.0<br />
Myanmar 1 144 .. 48.3 34 2.0 62.4 67 63 8.3 11.5<br />
Philippines 2 370 3 638 94.9 49 3.1 25.4 72 66 3.2 4.8<br />
Singapore 50 087 53 547 5.2 100 1.3 2.6 83 79 6.4 6.2<br />
Thail<strong>and</strong> 5 318 7 635 69.5 34 1.6 12.3 78 71 4.1 4.2<br />
Timor-Leste 4 829 1 420 1.2 29 6.1 54.1 63 62 2.6 20.8<br />
Viet Nam 1 392 2 980 88.8 31 1.8 21.7 77 73 7.7 7.2<br />
South <strong>and</strong> South-West <strong>Asia</strong> 2 003 3 364 1 802.1 34 2.6 59.3 68 65 4.4 6.5<br />
Afghanistan 586 1 098 32.4 23 6.2 101.1 49 49 -4.3 12.8<br />
Bangladesh 706 1 569 150.5 29 2.2 46.0 70 68 4.9 6.0<br />
Bhutan 2 336 5 162 0.7 35 2.3 53.7 69 65 5.9 8.5<br />
India 1 528 3 203 1 241.5 30 2.6 61.3 67 64 6.0 7.7<br />
Iran (Islamic Republic of) 6 977 .. 74.8 71 1.6 25.0 75 71 3.2 5.3<br />
Maldives 6 405 7 834 0.3 41 1.7 10.7 78 76 6.5 7.2<br />
Nepal 607 1 106 30.5 19 2.7 48.0 70 68 4.9 3.8<br />
Pakistan 1 182 2 424 176.7 36 3.3 72.0 66 65 3.6 4.6<br />
Sri Lanka 2 812 4 888 21.0 14 2.3 12.2 78 72 4.6 6.2<br />
Turkey 10 524 13 468 73.6 70 2.1 15.2 76 72 3.0 5.3<br />
<strong>North</strong> <strong>and</strong> Central <strong>Asia</strong> 10 026 11 618 221.0 63 1.8 27.3 74 64 -2.8 5.2<br />
Armenia 3 270 5 112 3.1 64 1.7 17.5 77 71 -1.7 7.6<br />
Azerbaijan 6 813 8 758 9.3 52 2.2 44.7 74 68 -4.2 13.9<br />
Georgia 3 319 5 001 4.3 53 1.5 20.5 77 70 -6.7 6.4<br />
Kazakhstan 11 503 11 819 16.2 59 2.5 28.3 72 62 -1.2 7.6<br />
Kyrgyzstan 1 098 2 163 5.4 35 2.7 30.6 72 64 -2.7 4.1<br />
Russian Federation 13 006 14 727 142.8 73 1.5 11.9 75 63 -2.9 4.7<br />
Tajikistan 935 2 052 7.0 26 3.2 63.3 71 64 -7.7 7.9<br />
Turkmenistan 5 042 8 319 5.1 50 2.4 52.5 69 61 -1.5 8.8<br />
Uzbekistan 1 641 3 068 27.8 36 2.3 48.6 71 65 0.3 7.4<br />
Pacific 46 565 25 130 37.2 71 2.4 23.7 79 75 3.8 2.9<br />
Developing economies 3 816 2 651 10.1 21 3.6 50.1 67 63 2.2 3.1<br />
American Samoa .. .. 0.1 .. .. .. .. .. .. ..<br />
Cook Isl<strong>and</strong>s 13 478 .. - .. .. 9.5 .. .. 2.6 1.0<br />
Fiji 4 391 4 201 0.9 52 2.639 16.4 72 67 2.8 1.4<br />
French Polynesia 26 290 .. 0.3 51 2.1 .. 78 73 1.8 1.9<br />
Guam .. .. 0.2 93 2.4 .. 79 74 ..<br />
Kiribati 1 803 2 063 0.1 .. .. 47.4 .. .. 2.7 1.6<br />
Marshall Isl<strong>and</strong>s 3 448 0.1 .. .. 26.2 .. .. 1.2 2.8<br />
Micronesia (Federated States of) 2 855 3 013 0.1 23 3.39 41.5 70 68 1.7 0.1<br />
Nauru 6 954 .. - .. 40.0 .. .. -9.8 -1.0<br />
New Caledonia 38 690 .. 0.3 57 2.122 80 73 1.4 3.5<br />
Niue .. .. - .. .. 21.1 .. .. .. ..<br />
<strong>North</strong> Mariana Isl<strong>and</strong>s .. .. 0.1 .. .. .. .. .. .. ..<br />
Palau 11 096 12 149 - .. .. 18.6 .. .. 1.7 1.6<br />
Papua New Guinea 1 794 2 363 7.0 13 3.891 57.8 65 61 3.6 4.9<br />
Samoa 3 629 3 952 0.2 20 3.8 18.7 76 70 3.6 2.3<br />
Solomon Isl<strong>and</strong>s 1 518 2 581 0.6 19 4.2 21.6 69 66 0.8 5.4<br />
Tonga 4 335 4 315 0.1 24 3.9 15.4 75 69 2.4 1.4<br />
Tuvalu 3 713 .. - .. .. 30.1 .. .. 4.8 0.4<br />
Vanuatu 3 168 3 930 0.2 26 3.82 13.2 73 69 2.0 3.9<br />
Developed economies 62 111 32 777 27.0 89 2.0 4.7 84 80 3.9 2.9<br />
Australia 67 039 34 418 22.6 89 2.0 4.5 84 80 3.9 3.0<br />
New Zeal<strong>and</strong> 36 874 24 377 4.4 86 2.2 5.9 83 79 3.5 2.1<br />
<strong>Asia</strong> <strong>and</strong> the Pacific 5 748 6 832 4 217.7 43 2.1 41.7 72 68 2.7 4.6<br />
Developing ESCAP economies 4 108 5 873 4 064.2 42 2.1 42.5 71 68 4.5 7.3<br />
Least Developed Countries 805 1 517 285.3 28 2.6 59.9 66 65 4.6 7.2<br />
L<strong>and</strong>locked Developing Countries 2 728 3 705 146.5 34 3.2 64.6 66 62 -1.2 8.3<br />
Developed ESCAP economies 49 171 31 297 153.5 71 1.5 3.6 86 80 1.2 1.0<br />
Africa 1 811 2 711 1 045.9 40 4.4 100.2 59 56 2.6 4.7<br />
Europe 32 055 25 665 597.6 73 1.6 5.4 82 76 2.2 1.4<br />
Latin America <strong>and</strong> the Caribbean 9 727 10 472 596.6 80 2.2 19.3 77 71 2.9 3.5<br />
<strong>North</strong> America 48 155 41 648 347.6 82 2.0 7.8 81 76 3.5 1.6<br />
World 10 035 10 132 6 974.0 51 2.5 52.5 71 67 2.8 2.6<br />
Sources <strong>and</strong> notes appear in the technical notes at the end of the annex.


