

Full Report - Subregional Office for East and North-East Asia - escap
Full Report - Subregional Office for East and North-East Asia - escap
Full Report - Subregional Office for East and North-East Asia - escap

You also want an ePaper? Increase the reach of your titles
YUMPU automatically turns print PDFs into web optimized ePapers that Google loves.
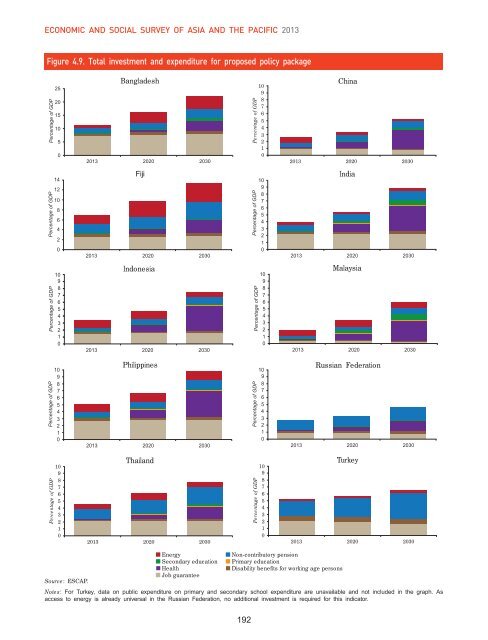
ECONOMIC AND SOCIAL SURVEY OF ASIA AND THE PACIFIC 2013<br />
Figure 4.9. Total investment <strong>and</strong> expenditure <strong>for</strong> proposed policy package<br />
Percentage of GDP<br />
Percentage of GDP<br />
Percentage of GDP<br />
Percentage of GDP<br />
Percentage of GDP<br />
25<br />
20<br />
15<br />
10<br />
5<br />
0<br />
14<br />
12<br />
10<br />
8<br />
6<br />
4<br />
2<br />
0<br />
10<br />
9<br />
8<br />
7<br />
6<br />
5<br />
4<br />
3<br />
2<br />
1<br />
0<br />
10<br />
9<br />
8<br />
7<br />
6<br />
5<br />
4<br />
3<br />
2<br />
1<br />
0<br />
10<br />
9<br />
8<br />
7<br />
6<br />
5<br />
4<br />
3<br />
2<br />
1<br />
0<br />
Source: ESCAP.<br />
Bangladesh<br />
Bangladesh<br />
Fiji<br />
2013 2020 2030<br />
Fiji<br />
10.0<br />
Indonesia<br />
9.0<br />
8.0<br />
7.0<br />
Indonesia6.0<br />
5.0<br />
4.0<br />
3.0<br />
2.0<br />
1.0<br />
0.0<br />
2013 2020 2030<br />
Cost of energy expenditure<br />
Philippines Spending on secondary education<br />
Health spending<br />
Cost of work program<br />
Thail<strong>and</strong><br />
Percentage of GDP<br />
2013<br />
Philippines<br />
2014<br />
2013 2020 2030<br />
Thail<strong>and</strong><br />
2013 2020 2030<br />
Energy<br />
Secondary education<br />
Health<br />
Job guarantee<br />
Notes: For Turkey, data on public expenditure on primary <strong>and</strong> secondary school expenditure are unavailable <strong>and</strong> not included in the graph. As<br />
access to energy is already universal in the Russian Federation, no additional investment is required <strong>for</strong> this indicator.<br />
Percentage of GDP<br />
10<br />
9<br />
8<br />
7<br />
6<br />
5<br />
4<br />
3<br />
2<br />
1<br />
0<br />
China<br />
China<br />
India<br />
2013 2020 2030<br />
Energy<br />
Non-contributory India pension<br />
10Secondary education Primary education<br />
9Health<br />
Disability benefits <strong>for</strong> working age persons<br />
8Job guarantee<br />
7<br />
6<br />
5<br />
China 4<br />
3<br />
2<br />
1<br />
0<br />
2013 Malaysia 2020 2030<br />
2015<br />
2016<br />
2017<br />
2018<br />
2019<br />
2020<br />
2021<br />
Percentage 2022 of GDP<br />
2023<br />
2024<br />
2025<br />
2026<br />
2027<br />
2028<br />
2029<br />
2030<br />
China<br />
Percentage of GDP<br />
Percentage of GDP<br />
Percentage of GDP<br />
10<br />
9<br />
8<br />
7<br />
6<br />
5<br />
4<br />
3<br />
2<br />
1<br />
0<br />
10<br />
9<br />
8<br />
7<br />
6<br />
5<br />
4<br />
3<br />
2<br />
1<br />
0<br />
Malaysia<br />
Cost of non-contributory pension<br />
Spending Russian on primary Federation education<br />
Disability benefits <strong>for</strong> working age persons<br />
Non-contributory pension<br />
Primary education<br />
Disability benefits <strong>for</strong> working age persons<br />
2013 Russia 2020 Federation 2030<br />
2013 Turkey 2020 2030<br />
Turkey<br />
10<br />
10<br />
9<br />
9<br />
8<br />
8<br />
7<br />
7<br />
6<br />
6<br />
5<br />
5<br />
4<br />
4<br />
3<br />
3<br />
2<br />
2<br />
1<br />
1<br />
0<br />
0<br />
2013 2020 20132030<br />
2020<br />
2013<br />
2030<br />
2020 2030<br />
192


