- Page 1 and 2:
AGENDA CITY OF WATSONVILLE CITY COU
- Page 3 and 4:
8.1 DEVELOPMENT OF APPLICATION TO S
- Page 5 and 6:
4.6 RESOLUTION APPROVING FY 2011/20
- Page 7:
(l) (m) (n) (o) City Council Resolu
- Page 11 and 12:
NOES: ABSENT: MEMBERS: None MEMBERS
- Page 13 and 14:
City Manager Palacios clarified som
- Page 15 and 16:
Moss, Levy & Hartzheim, CPA's have
- Page 17 and 18:
Fiscal Year Max Amount 2010-11 $39,
- Page 19 and 20:
from these cuts. If this bill moves
- Page 21 and 22:
CITY COUNCIL/REDEV #8.1 (e) RESOLUT
- Page 23 and 24:
SECTION 6. INDEPENDENT CONTRACTOR.
- Page 25 and 26:
D. In the event of termination, Con
- Page 27 and 28:
WITNESS THE EXECUTION HEREOF, on th
- Page 29 and 30:
EXHIBIT "B" SCHEDULE OF PERFORMANCE
- Page 31 and 32:
CITY COUNCIL/REDEV #8.2 (a) City of
- Page 33 and 34:
This program is another tool that t
- Page 35 and 36:
Table of Contents Mission Statement
- Page 37 and 38:
Defining the Regional Center’s Ge
- Page 39 and 40:
Watsonville’s Opportunities Despi
- Page 41 and 42:
Jennings Industrial Park Jennings I
- Page 43 and 44:
for redevelopment in the City. The
- Page 45 and 46:
Ownership of the CSRC California Su
- Page 47 and 48:
Mr. Keinan started off his career i
- Page 49 and 50:
Marketing To maximize its potential
- Page 51 and 52:
Investment structure The CSRC will
- Page 53 and 54:
The categories of business activity
- Page 55 and 56:
Guy Spencer Houston 808 Beaver Cree
- Page 57 and 58:
GIL KEINAN, MBA 553 17 th Avenue S
- Page 59 and 60:
San Francisco Convention and Visito
- Page 61 and 62:
CLARABELLE PONG, LEED GA clarabelle
- Page 63 and 64:
CITY COUNCIL 8.2 (f) RESOLUTION NO.
- Page 65 and 66:
According to the Manabe-Ow Business
- Page 67 and 68:
• Santa Cruz County shall be list
- Page 69 and 70:
CITY COUNCIL 4.2 UNADOPTED MINUTES
- Page 71 and 72:
? 0 5 industry.—Bring back to Cou
- Page 73 and 74:
Vol 59 Min-CC051711special.docx Ran
- Page 75 and 76:
Vol 59 Min-CC051711special.docx 5 5
- Page 77 and 78:
UNADOPTED MINUTES REGULAR CITY COUN
- Page 79 and 80:
4.5 RESOLUTION NO. 85-11 (CM): A RE
- Page 81 and 82:
Deborah Bone, Director Stroke and D
- Page 83 and 84:
Member Bilicich requested that when
- Page 85 and 86:
Member Hurst said he was pleased to
- Page 87 and 88:
(a) (b) (c) (d) (e) Staff Report Th
- Page 89 and 90:
CITY COUNCIL 4.3 City of Watsonvill
- Page 91 and 92:
CITY COUNCIL 4.3 RESOLUTION NO.____
- Page 93 and 94:
CITY COUNCIL 4.4 City of Watsonvill
- Page 95 and 96:
CITY COUNCIL 4.4 parents, students,
- Page 103 and 104:
CITY COUNCIL 4.5 City of Watsonvill
- Page 105 and 106:
Type of Project be eligible under s
- Page 107 and 108:
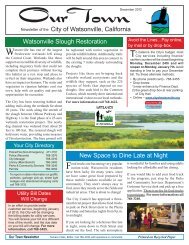
sloughs, which are a nature preserv
- Page 109 and 110:
CITY COUNCIL 4.5 RESOLUTION NO. (CM
- Page 111 and 112:
CITY COUNCIL 4.6 City of Watsonvill
- Page 113 and 114: Attachment 1 Page 1 of 2
- Page 115 and 116: CITY COUNCIL 4.6 RESOLUTION NO.____
- Page 117: CITY COUNCIL 4.7
- Page 120 and 121: CITY COUNCIL 4.8 RESOLUTION NO.____
- Page 122 and 123: CITY COUNCIL 6.1 (a) City of Watson
- Page 124 and 125: City Water Conservation Program. Th
- Page 126 and 127: pumping by agricultural water users
- Page 128 and 129: City of Watsonville 2010 Urban Wate
- Page 130 and 131: Water Quality .....................
- Page 132 and 133: TABLE 5.8 - Water Shortage Continge
- Page 134 and 135: Coordinating Agencies Table 1.1 - (
- Page 136 and 137: Section 2 - System Description 8
- Page 138 and 139: Table 2.1 - Service Area Climate Ja
- Page 140 and 141: Per Capita Water Use Section 3 - Sy
- Page 142 and 143: It is the State of California’s g
- Page 144 and 145: Table 3.7 - (UWMP Table 6) Water de
- Page 146 and 147: extremely low income households in
- Page 148 and 149: #14. (Is) groundwater . . . identif
- Page 150 and 151: #19. For basins that have not been
- Page 152 and 153: #46. (Describe) the quantity of tre
- Page 154 and 155: Table 4.7 - (UWMP Table 23) Recycle
- Page 156 and 157: Section 5 - Water Supply Reliabilit
- Page 158 and 159: the ability to achieve a water use
- Page 160 and 161: The Utilities Department is charged
- Page 162 and 163: The City will strictly follow the r
- Page 166 and 167: Section 6 - Demand Management Measu
- Page 168 and 169: B. Residential Plumbing Retrofit In
- Page 170 and 171: D. Metering with Commodity Rates fo
- Page 172 and 173: Conservation (LWC) Program service
- Page 174 and 175: G. Public Information Programs The
- Page 176 and 177: H. School Education Programs The Ci
- Page 178 and 179: J. Wholesale Agency Programs As the
- Page 180 and 181: L. Water Conservation Coordinator T
- Page 182 and 183: N. Residential Ultra-lowflush Toile
- Page 184 and 185: The IRWMP update must address both
- Page 186 and 187: Table 7.1 - Solar Projects KWH gene
- Page 188 and 189: programs and policies to preserve w
- Page 190: Table of Contents Executive Summary
- Page 193 and 194: Council Goals. At their March 8 goa
- Page 195 and 196: Goal II: Community Resources Object
- Page 197 and 198: Goal IV: Safe & Healthy Community O
- Page 199 and 200: Current Initiatives Administration
- Page 201 and 202: Current Initiatives Finance Resourc
- Page 203 and 204: Current Initiatives Fire Resources
- Page 205 and 206: Current Initiatives POLICE Resource
- Page 207 and 208: Current Initiatives Public Works &
- Page 209 and 210: Public Works & Utilities Core Missi
- Page 211 and 212: Department Core Mission (Partial Li
- Page 213 and 214: Rank 3 Administration Possible New
- Page 215 and 216:
Rank 13 4 Public Works Possible New
- Page 217 and 218:
Appendix 28
- Page 219 and 220:
11. Increase rental fees of City Pl
- Page 221 and 222:
Other Library provides wonderful se
- Page 223 and 224:
Bulk purchase with other agencies U
- Page 225 and 226:
CITY COUNCIL/REDEV # 6.2 (b) DATE:
- Page 227 and 228:
DISCUSSION: The City is faced with
- Page 229 and 230:
Millions $7 $6 $5 $4 $3 $2 $1 $- An
- Page 231 and 232:
Pending Threat- Redevelopment Agenc
- Page 233 and 234:
Exhibit 10 below summarizes the top
- Page 235 and 236:
BUDGETARY ACTIONS Utility Fund paym
- Page 237 and 238:
percentage change in either of two
- Page 239 and 240:
STRATEGIC PLAN: The proposed budget
- Page 241 and 242:
Attachment 1 Capital Improvement Pr
- Page 243 and 244:
Attachment 1 Capital Improvement Pr
- Page 245 and 246:
GENERAL FUND SUMMARY Attachment 2 G
- Page 247 and 248:
GENERAL FUND SUMMARY Attachment 2 A
- Page 249 and 250:
GENERAL FUND SUMMARY Attachment 2 A
- Page 251 and 252:
CITY COUNCIL/REDEV# 6.2 (h) RESOLUT
- Page 253 and 254:
This Fund Balance Policy establishe
- Page 255 and 256:
CITY COUNCIL/REDEV# 6.2 (j) RESOLUT
- Page 257 and 258:
Clerk, is hereby approved as the fi
- Page 259 and 260:
CITY OF WATSONVILLE & REDEVELOPMENT
- Page 261 and 262:
1122(b)(3) of the Charter of the Ci
- Page 263 and 264:
CITY COUNCIL/REDEV# 6.2 (l) RESOLUT
- Page 265 and 266:
CITY COUNCIL/REDEV# 6.2 (m) RESOLUT
- Page 267 and 268:
CITY COUNCIL/REDEV# 6.2 (o) RESOLUT
- Page 269 and 270:
CITY COUNCIL/REDEV# 6.2 (p) RESOLUT
- Page 271 and 272:
CITY COUNCIL 6.2 (q) RESOLUTION NO.
- Page 273:
Table of Contents Executive Summary
- Page 276 and 277:
Council Goals. At their March 8 goa
- Page 278 and 279:
Goal II: Community Resources Object
- Page 280 and 281:
Goal IV: Safe & Healthy Community O
- Page 282 and 283:
Current Initiatives Administration
- Page 284 and 285:
Current Initiatives Finance Resourc
- Page 286 and 287:
Current Initiatives Fire Resources
- Page 288 and 289:
Current Initiatives POLICE Resource
- Page 290 and 291:
Current Initiatives Public Works &
- Page 292 and 293:
Public Works & Utilities Core Missi
- Page 294 and 295:
Department Core Mission (Partial Li
- Page 296 and 297:
Rank 3 Administration Possible New
- Page 298 and 299:
Rank 13 4 Public Works Possible New
- Page 300 and 301:
Appendix 28
- Page 302 and 303:
11. Increase rental fees of City Pl
- Page 304 and 305:
Other Library provides wonderful se
- Page 306 and 307:
Bulk purchase with other agencies U
- Page 308 and 309:
CITY COUNCIL/REDEV# 6.2 (r) RESOLUT
- Page 310 and 311:
CITY COUNCIL/REDEV# 6.2 (s) Page 1
- Page 312 and 313:
CITY COUNCIL/REDEV# 6.2 (s) RESOLUT
- Page 314 and 315:
CITY COUNCIL/REDEV# 6.2 (t) City of
- Page 316 and 317:
CITY COUNCIL/REDEV# 6.2 (t) RESOLUT
- Page 318 and 319:
CITY COUNCIL 8.1 (a) City of Watson
- Page 320 and 321:
ATTACHMENT 1 Page 1 of 6
- Page 322 and 323:
ATTACHMENT 1 Page 3 of 6
- Page 324 and 325:
ATTACHMENT 1 Page 5 of 6
- Page 326 and 327:
ATTACHMENT 2 Page 1 of 5
- Page 328 and 329:
ATTACHMENT 2 Page 3 of 5
- Page 330 and 331:
ATTACHMENT 2 Page 5 of 5
- Page 332 and 333:
Verbatim transcription of audio rec
- Page 334 and 335:
Verbatim transcription of audio rec