Integrating Essential Skills into Training - National Adult Literacy ...
Integrating Essential Skills into Training - National Adult Literacy ...
Integrating Essential Skills into Training - National Adult Literacy ...

You also want an ePaper? Increase the reach of your titles
YUMPU automatically turns print PDFs into web optimized ePapers that Google loves.
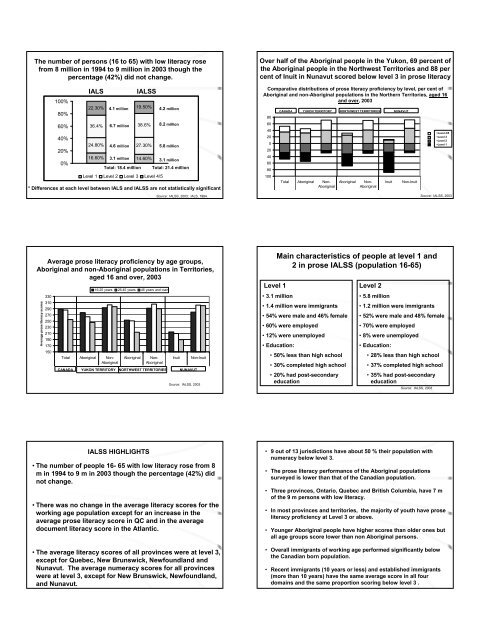
The number of persons (16 to 65) with low literacy rose Over half of the Aboriginal people in the Yukon, 69 percent of<br />
from 8 million in 1994 to 9 million in 2003 though the the Aboriginal people in the Northwest Territories and 88 per<br />
percentage (42%) did not change. cent of Inuit in Nunavut scored below level 3 in prose literacy<br />
Average prose literacy scores<br />
100%<br />
80%<br />
IALS IALSS<br />
22.30% 4.1 million 19.50% 4.2 million<br />
Comparative distributions of prose literacy proficiency by level, per cent of<br />
Aboriginal and non-Aboriginal populations in the Northern Territories, aged 16<br />
and over, 2003<br />
80<br />
CANADA YUKON TERRITORY NORTHWEST TERRITORIES NUNAVUT<br />
60% 36.4% 6.7 million 38.6% 8.2 million<br />
60<br />
40<br />
40%<br />
24.80% 4.6 million 27.30% 5.8 million<br />
20<br />
0<br />
Level 4/5<br />
Level 3<br />
Level 2<br />
Level 1<br />
20%<br />
20<br />
0%<br />
16.60% 3.1 million 14.60% 3.1 million<br />
Total: 18.4 million Total: 21.4 million<br />
40<br />
60<br />
80<br />
Level 1 Level 2 Level 3 Level 4/5 100<br />
* Differences at each level between IALS and IALSS are not statistically significant<br />
Source: IALSS, 2003; IALS, 1994.<br />
Average prose literacy proficiency by age groups,<br />
Aboriginal and non-Aboriginal populations in Territories,<br />
aged 16 and over, 2003<br />
16-25 years 26-45 years 46 years and over<br />
Total Aboriginal Non- Aboriginal Non- Inuit Non-Inuit<br />
Aboriginal Aboriginal<br />
Source: IALSS, 2003<br />
Main characteristics of people at level 1 and<br />
2 in prose IALSS (population 16-65)<br />
Level 1 Level 2<br />
330 • 3.1 million • 5.8 million<br />
310<br />
290<br />
• 1.4 million were immigrants • 1.2 million were immigrants<br />
270 • 54% were male and 46% female • 52% were male and 48% female<br />
250<br />
230 • 60% were employed • 70% were employed<br />
210<br />
190<br />
• 12% were unemployed • 8% were unemployed<br />
170 • Education: • Education:<br />
150<br />
Total Aboriginal Non- Aboriginal Non- Inuit Non-Inuit • 50% less than high school • 28% less than high school<br />
Aboriginal Aboriginal<br />
• 30% completed high school • 37% completed high school<br />
CANADA YUKON TERRITORY NORTHWEST TERRITORIES NUNAVUT<br />
• 20% had post-secondary • 35% had post-secondary<br />
education education<br />
Source: IALSS, 2003<br />
Source: IALSS, 2003<br />
IALSS HIGHLIGHTS<br />
• The number of people 16- 65 with low literacy rose from 8<br />
m in 1994 to 9 m in 2003 though the percentage (42%) did<br />
not change.<br />
• 9 out of 13 jurisdictions have about 50 % their population with<br />
numeracy below level 3.<br />
• The prose literacy performance of the Aboriginal populations<br />
surveyed is lower than that of the Canadian population.<br />
• Three provinces, Ontario, Quebec and British Columbia, have 7 m<br />
of the 9 m persons with low literacy.<br />
• There was no change in the average literacy scores for the<br />
• In most provinces and territories, the majority of youth have prose<br />
working age population except for an increase in the<br />
literacy proficiency at Level 3 or above.<br />
average prose literacy score in QC and in the average<br />
document literacy score in the Atlantic. • Younger Aboriginal people have higher scores than older ones but<br />
all age groups score lower than non Aboriginal persons.<br />
• The average literacy scores of all provinces were at level 3,<br />
except for Quebec, New Brunswick, Newfoundland and<br />
• Overall immigrants of working age performed significantly below<br />
the Canadian born population.<br />
Nunavut. The average numeracy scores for all provinces • Recent immigrants (10 years or less) and established immigrants<br />
were at level 3, except for New Brunswick, Newfoundland, (more than 10 years) have the same average score in all four<br />
and Nunavut.<br />
domains and the same proportion scoring below level 3 .