Integrating Essential Skills into Training - National Adult Literacy ...
Integrating Essential Skills into Training - National Adult Literacy ...
Integrating Essential Skills into Training - National Adult Literacy ...

Create successful ePaper yourself
Turn your PDF publications into a flip-book with our unique Google optimized e-Paper software.
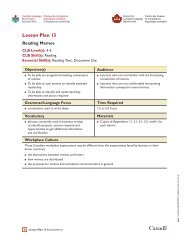
Document Use<br />
Document use refers to tasks that involve different kinds of information designs or displays.<br />
The displays can use words, numbers, letters, symbols, graphics and other visual or auditory<br />
characteristics (line, colour, light, shape, sound, etc.). Documents are intended to provide<br />
information “at a glance.” In the workplace, you use documents such as:<br />
• assembly drawings • icons • logbooks<br />
• lists • sketches • maps<br />
• graphs • labels • flags<br />
• scale drawings • forms • signs<br />
• schedules • colour codes • ultrasound imaging<br />
• tables • diagrams • light or sound signals<br />
• radiographs • pictures • schematics<br />
• films/movies • musical scores • bills of lading<br />
Document use involves reading, interpreting, and writing (these may occur simultaneously<br />
such as when you complete a form). Document use can also involve the actual creation or<br />
production of documents. Document use includes print and non-print information display<br />
(computer screens, television screens, LCD displays, whiteboards, measurement gauges, etc.).<br />
Document Types<br />
Signs, Simple Lists, and Labels – these are formats that may comprise text, numbers, symbols,<br />
icons, pictures, drawings, etc. Workers may read or create these document structures.<br />
Forms – these are structured documents that may comprise lists or combinations of lists.<br />
Workers complete forms by adding information and/or read completed forms as information<br />
sources. Forms may feature checkboxes, numerical information, phrases, sentences and/or<br />
paragraphs.<br />
Tables and Schedules – these are compact arrangements of words, numbers or signs (or<br />
combinations of them) in rows and columns to display a set of facts or relationships. Tables<br />
and schedules are the result of combining two or more simple lists. Grid lines may or may not<br />
be shown. Workers read and create tables and schedules as well as enter information <strong>into</strong><br />
them. Examples of table and schedule types: combined lists, intersecting lists, nested lists.<br />
(Most forms are simply combinations of tables and lists.) Some tables are refered to as charts.<br />
Graphical Presentations – these are pictorial displays of numerical data; that is, a simple<br />
means of showing a change in one function in relation to a change in another. Graphs are used<br />
to illustrate how a value or quantity changes over time, or the distribution of data across a set<br />
of categories for the purpose of comparing values. Graphs may consist of a line connecting<br />
points plotted on an x and y axis. (Research shows that 40% of Canadians have a less than an<br />
80% chance of correctly answering a question based on a simple line graph.) Bar-type graphs<br />
emphasize the difference in value between various pieces or sets of data by using parallel<br />
bars. Pie or circle graphs accent the relationship between the parts of a thing and the whole.