1.1 Porphyrins - Friedrich-Alexander-Universität Erlangen-Nürnberg
1.1 Porphyrins - Friedrich-Alexander-Universität Erlangen-Nürnberg
1.1 Porphyrins - Friedrich-Alexander-Universität Erlangen-Nürnberg

You also want an ePaper? Increase the reach of your titles
YUMPU automatically turns print PDFs into web optimized ePapers that Google loves.
3 Discussion and Results<br />
Thus, the most drastic NH-shifts to lower field are observed for the 3-17 bis-annulated<br />
systems being around 2.5 ppm compared to the precursor, while those are around 1.7 and<br />
1.3 ppm for the systems being 3-13 or 3-7 annulated, respectively. In this regard, the<br />
conjugational impact of the electron withdrawing ketone groups is of major importance. For<br />
example, in 68 (largest shift), the whole π-system is involved as the ketone groups sit on<br />
opposite sides while in 71 (lowest shift), only four bonds of that π-system might be directly<br />
affected.<br />
This explanation is also supported by the resonances of the carbonyl carbon atoms in the<br />
corresponding 13 C NMR spectra. Also here, the signals experience a shift to lower field when<br />
the size of the conjugated system between the ketone groups is increased 46 from 71<br />
(190.1 ppm) over 67 & 69 (191.0 ppm) to 68 & 70 (192.2 ppm).<br />
3.2.7.4 UV/Vis Spectroscopy<br />
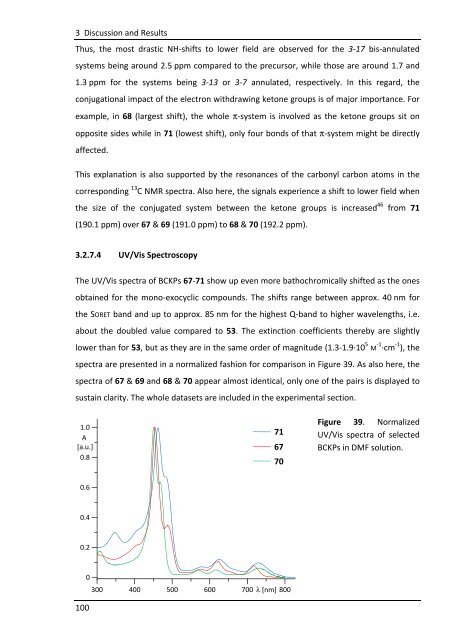
The UV/Vis spectra of BCKPs 67-71 show up even more bathochromically shifted as the ones<br />
obtained for the mono-exocyclic compounds. The shifts range between approx. 40 nm for<br />
the SORET band and up to approx. 85 nm for the highest Q-band to higher wavelengths, i.e.<br />
about the doubled value compared to 53. The extinction coefficients thereby are slightly<br />
lower than for 53, but as they are in the same order of magnitude (1.3-1.9·10 5 M -1 ·cm -1 ), the<br />
spectra are presented in a normalized fashion for comparison in Figure 39. As also here, the<br />
spectra of 67 & 69 and 68 & 70 appear almost identical, only one of the pairs is displayed to<br />
sustain clarity. The whole datasets are included in the experimental section.<br />
1.0<br />
A<br />
[a.u.]<br />
0.8<br />
0.6<br />
0.4<br />
0.2<br />
0<br />
100<br />
71<br />
67<br />
70<br />
300 400 500 600 700 λ [nm] 800<br />
Figure 39. Normalized<br />
UV/Vis spectra of selected<br />
BCKPs in DMF solution.