1.1 Porphyrins - Friedrich-Alexander-Universität Erlangen-Nürnberg
1.1 Porphyrins - Friedrich-Alexander-Universität Erlangen-Nürnberg
1.1 Porphyrins - Friedrich-Alexander-Universität Erlangen-Nürnberg

Create successful ePaper yourself
Turn your PDF publications into a flip-book with our unique Google optimized e-Paper software.
OD<br />
0.5<br />
0.4<br />
0.3<br />
0.2<br />
0.1<br />
0<br />
230 K<br />
500 600 λ [nm] 700<br />
fluorescence<br />
3·10 4<br />
2·10 4<br />
1·10 4<br />
0<br />
295 K<br />
295 K<br />
Discussion and Results 3<br />
The origin of those three components was clarified taking into account the following facts:<br />
• 53 appears “chemically pure”, meaning at least >98 % purity bsd. on analytic means<br />
• component C is only detectable as it has a quite different fluorescence life-time and<br />
as the fluorescence of the major components is a priori low<br />
• regular metallo-porphyrins like Zn(II)-53 (which will be discussed later) only show one<br />
major fluorophore<br />
• variations in concentration (e.g. high dilution) do not change the ratio P(A) : P(B)<br />
Thus, C could be assigned an impurity – maybe free base TTBPP 19 or any other synthetic<br />
residue. Concerning A and B, it seemed to be clear, that they could not be monomer and<br />
dimer or any other aggregate and that it has to be a specific feature of free base compound<br />
53. One possible explanation could be the presence of distinct tautomeric structures with<br />
differing photophysical properties, like the already presented VT-NMR studies hinted to.<br />
3.2.3.4.2 Fluorescence Spectroscopy at Varied Temperatures 108<br />
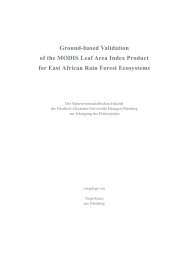
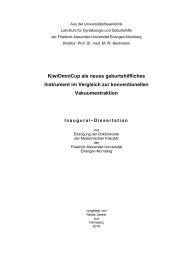
To verify the abovementioned assumption, temperature dependent absorption and<br />
fluorescence spectra were recorded in solution. Changing the temperature should thereby<br />
have a significant effect onto the equilibrium position between both tautomeric structures<br />
resulting in varying shapes in both spectra. Some results are depicted in Figure 22.<br />
290 K<br />
230 K<br />
290 K<br />
225 K<br />
660 720 λ [nm]<br />
Figure 22. Temperature dependent absorption spectra (left) and fluorescence spectra (right,<br />
excitation at 532 nm) of 53.<br />
From those findings, several conclusions can be deduced. The ratio 𝑟 �� of tautomers<br />
P(A):P(B) is temperature dependent whereas at lower temperatures, one tautomer (e.g.<br />
tautomer A) becomes more predominant. A quantitative evaluation can then be achieved by<br />
780<br />
55