

PROFITABLE GROWTH FOR ALL

Create successful ePaper yourself
Turn your PDF publications into a flip-book with our unique Google optimized e-Paper software.
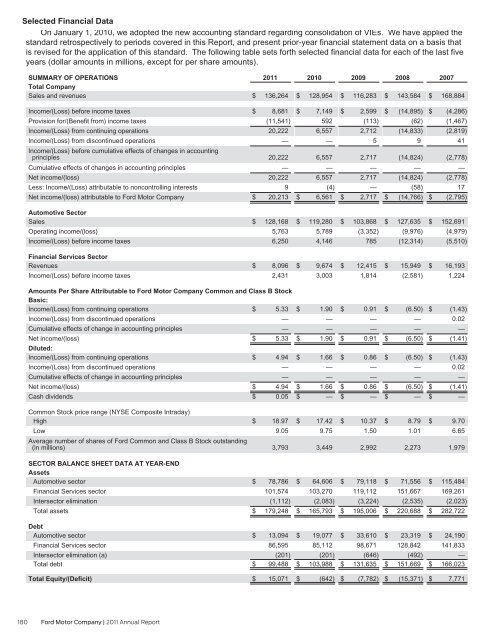
Selected Financial Data<br />
On January 1, 2010, we adopted the new accounting standard regarding consolidation of VIEs. We have applied the<br />
standard retrospectively to periods covered in this Report, and present prior-year financial statement data on a basis that<br />
is revised for the application of this standard. The following table sets forth selected financial data for each of the last five<br />
years (dollar amounts in millions, except for per share amounts).<br />
SUMMARY OF OPERATIONS<br />
Total Company<br />
Sales and revenues<br />
2011<br />
$ 136,264<br />
2010<br />
$ 128,954<br />
2009<br />
$ 116,283<br />
2008<br />
$ 143,584<br />
2007<br />
$ 168,884<br />
Income/(Loss) before income taxes<br />
Provision for/(Benefit from) income taxes<br />
Income/(Loss) from continuing operations<br />
Income/(Loss) from discontinued operations<br />
Income/(Loss) before cumulative effects of changes in accounting<br />
principles<br />
Cumulative effects of changes in accounting principles<br />
Net income/(loss)<br />
Less: Income/(Loss) attributable to noncontrolling interests<br />
Net income/(loss) attributable to Ford Motor Company<br />
$ 8,681<br />
(11,541)<br />
20,222<br />
—<br />
20,222<br />
—<br />
20,222<br />
9<br />
$ 20,213<br />
$ 7,149<br />
592<br />
6,557<br />
—<br />
6,557<br />
—<br />
6,557<br />
(4)<br />
$ 6,561<br />
$ 2,599<br />
(113)<br />
2,712<br />
5<br />
2,717<br />
—<br />
2,717<br />
—<br />
$ 2,717<br />
$ (14,895)<br />
(62)<br />
(14,833)<br />
9<br />
(14,824)<br />
—<br />
(14,824)<br />
(58)<br />
$ (14,766)<br />
$ (4,286)<br />
(1,467)<br />
(2,819)<br />
41<br />
(2,778)<br />
—<br />
(2,778)<br />
17<br />
$ (2,795)<br />
Automotive Sector<br />
Sales<br />
Operating income/(loss)<br />
Income/(Loss) before income taxes<br />
$ 128,168<br />
5,763<br />
6,250<br />
$ 119,280<br />
5,789<br />
4,146<br />
$ 103,868<br />
(3,352)<br />
785<br />
$ 127,635<br />
(9,976)<br />
(12,314)<br />
$ 152,691<br />
(4,979)<br />
(5,510)<br />
Financial Services Sector<br />
Revenues<br />
Income/(Loss) before income taxes<br />
$ 8,096<br />
2,431<br />
$ 9,674<br />
3,003<br />
$ 12,415<br />
1,814<br />
$ 15,949<br />
(2,581)<br />
$ 16,193<br />
1,224<br />
Amounts Per Share Attributable to Ford Motor Company Common and Class B Stock<br />
Basic:<br />
Income/(Loss) from continuing operations<br />
Income/(Loss) from discontinued operations<br />
Cumulative effects of change in accounting principles<br />
Net income/(loss)<br />
Diluted:<br />
Income/(Loss) from continuing operations<br />
Income/(Loss) from discontinued operations<br />
Cumulative effects of change in accounting principles<br />
Net income/(loss)<br />
Cash dividends<br />
$<br />
$<br />
$<br />
$<br />
$<br />
5.33<br />
—<br />
—<br />
5.33<br />
4.94<br />
—<br />
—<br />
4.94<br />
0.05<br />
$ 1.90<br />
—<br />
—<br />
$ 1.90<br />
$ 1.66<br />
—<br />
—<br />
$ 1.66<br />
$ —<br />
$ 0.91<br />
—<br />
—<br />
$ 0.91<br />
$ 0.86<br />
—<br />
—<br />
$ 0.86<br />
$ —<br />
$ (6.50)<br />
—<br />
—<br />
$ (6.50)<br />
$ (6.50)<br />
—<br />
—<br />
$ (6.50)<br />
$ —<br />
$ (1.43)<br />
0.02<br />
—<br />
$ (1.41)<br />
$ (1.43)<br />
0.02<br />
—<br />
$ (1.41)<br />
$ —<br />
Common Stock price range (NYSE Composite Intraday)<br />
High<br />
Low<br />
Average number of shares of Ford Common and Class B Stock outstanding<br />
(in millions)<br />
$ 18.97<br />
9.05<br />
3,793<br />
$ 17.42<br />
9.75<br />
3,449<br />
$ 10.37<br />
1.50<br />
2,992<br />
$ 8.79<br />
1.01<br />
2,273<br />
$ 9.70<br />
6.65<br />
1,979<br />
SECTOR BALANCE SHEET DATA AT YEAR-END<br />
Assets<br />
Automotive sector<br />
Financial Services sector<br />
Intersector elimination<br />
Total assets<br />
$ 78,786<br />
101,574<br />
(1,112)<br />
$ 179,248<br />
$ 64,606<br />
103,270<br />
(2,083)<br />
$ 165,793<br />
$ 79,118<br />
119,112<br />
(3,224)<br />
$ 195,006<br />
$ 71,556<br />
151,667<br />
(2,535)<br />
$ 220,688<br />
$ 115,484<br />
169,261<br />
(2,023)<br />
$ 282,722<br />
Debt<br />
Automotive sector<br />
Financial Services sector<br />
Intersector elimination (a)<br />
Total debt<br />
$ 13,094<br />
86,595<br />
(201)<br />
$ 99,488<br />
$ 19,077<br />
85,112<br />
(201)<br />
$ 103,988<br />
$ 33,610<br />
98,671<br />
(646)<br />
$ 131,635<br />
$ 23,319<br />
128,842<br />
(492)<br />
$ 151,669<br />
$ 24,190<br />
141,833<br />
—<br />
$ 166,023<br />
Total Equity/(Deficit)<br />
$ 15,071<br />
$ (642)<br />
$ (7,782)<br />
$ (15,371)<br />
$ 7,771<br />
180 Ford Motor Company | 2011 Annual Report