

PROFITABLE GROWTH FOR ALL

You also want an ePaper? Increase the reach of your titles
YUMPU automatically turns print PDFs into web optimized ePapers that Google loves.
Management’s Discussion and Analysis of Financial Condition and Results of Operations<br />
2010 Compared with 2009<br />
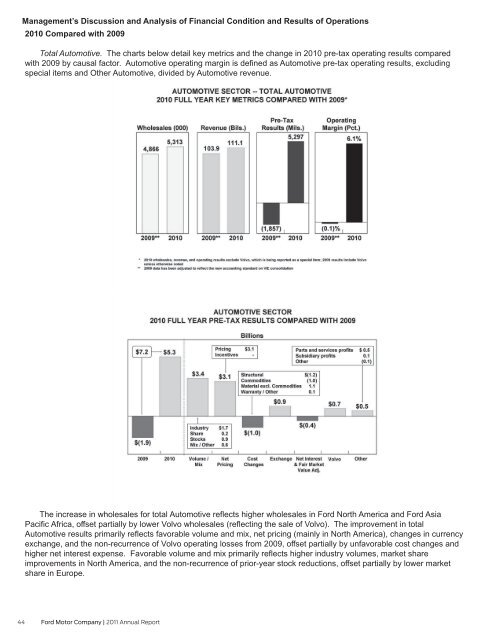
Total Automotive. The charts below detail key metrics and the change in 2010 pre-tax operating results compared<br />
with 2009 by causal factor. Automotive operating margin is defined as Automotive pre-tax operating results, excluding<br />
special items and Other Automotive, divided by Automotive revenue.<br />
The increase in wholesales for total Automotive reflects higher wholesales in Ford North America and Ford Asia<br />
Pacific Africa, offset partially by lower Volvo wholesales (reflecting the sale of Volvo). The improvement in total<br />
Automotive results primarily reflects favorable volume and mix, net pricing (mainly in North America), changes in currency<br />
exchange, and the non-recurrence of Volvo operating losses from 2009, offset partially by unfavorable cost changes and<br />
higher net interest expense. Favorable volume and mix primarily reflects higher industry volumes, market share<br />
improvements in North America, and the non-recurrence of prior-year stock reductions, offset partially by lower market<br />
share in Europe.<br />
44 Ford Motor Company | 2011 Annual Report