Selected Financial Data On January 1, 2010, we adopted the new accounting standard regarding consolidation of VIEs. We have applied the standard retrospectively to periods covered in this Report, and present prior-year financial statement data on a basis that is revised for the application of this standard. The following table sets forth selected financial data for each of the last five years (dollar amounts in millions, except for per share amounts). SUMMARY OF OPERATIONS Total Company Sales and revenues 2011 $ 136,264 2010 $ 128,954 2009 $ 116,283 2008 $ 143,584 2007 $ 168,884 Income/(Loss) before income taxes Provision for/(Benefit from) income taxes Income/(Loss) from continuing operations Income/(Loss) from discontinued operations Income/(Loss) before cumulative effects of changes in accounting principles Cumulative effects of changes in accounting principles Net income/(loss) Less: Income/(Loss) attributable to noncontrolling interests Net income/(loss) attributable to Ford Motor Company $ 8,681 (11,541) 20,222 — 20,222 — 20,222 9 $ 20,213 $ 7,149 592 6,557 — 6,557 — 6,557 (4) $ 6,561 $ 2,599 (113) 2,712 5 2,717 — 2,717 — $ 2,717 $ (14,895) (62) (14,833) 9 (14,824) — (14,824) (58) $ (14,766) $ (4,286) (1,467) (2,819) 41 (2,778) — (2,778) 17 $ (2,795) Automotive Sector Sales Operating income/(loss) Income/(Loss) before income taxes $ 128,168 5,763 6,250 $ 119,280 5,789 4,146 $ 103,868 (3,352) 785 $ 127,635 (9,976) (12,314) $ 152,691 (4,979) (5,510) Financial Services Sector Revenues Income/(Loss) before income taxes $ 8,096 2,431 $ 9,674 3,003 $ 12,415 1,814 $ 15,949 (2,581) $ 16,193 1,224 Amounts Per Share Attributable to Ford Motor Company Common and Class B Stock Basic: Income/(Loss) from continuing operations Income/(Loss) from discontinued operations Cumulative effects of change in accounting principles Net income/(loss) Diluted: Income/(Loss) from continuing operations Income/(Loss) from discontinued operations Cumulative effects of change in accounting principles Net income/(loss) Cash dividends $ $ $ $ $ 5.33 — — 5.33 4.94 — — 4.94 0.05 $ 1.90 — — $ 1.90 $ 1.66 — — $ 1.66 $ — $ 0.91 — — $ 0.91 $ 0.86 — — $ 0.86 $ — $ (6.50) — — $ (6.50) $ (6.50) — — $ (6.50) $ — $ (1.43) 0.02 — $ (1.41) $ (1.43) 0.02 — $ (1.41) $ — Common Stock price range (NYSE Composite Intraday) High Low Average number of shares of Ford Common and Class B Stock outstanding (in millions) $ 18.97 9.05 3,793 $ 17.42 9.75 3,449 $ 10.37 1.50 2,992 $ 8.79 1.01 2,273 $ 9.70 6.65 1,979 SECTOR BALANCE SHEET DATA AT YEAR-END Assets Automotive sector Financial Services sector Intersector elimination Total assets $ 78,786 101,574 (1,112) $ 179,248 $ 64,606 103,270 (2,083) $ 165,793 $ 79,118 119,112 (3,224) $ 195,006 $ 71,556 151,667 (2,535) $ 220,688 $ 115,484 169,261 (2,023) $ 282,722 Debt Automotive sector Financial Services sector Intersector elimination (a) Total debt $ 13,094 86,595 (201) $ 99,488 $ 19,077 85,112 (201) $ 103,988 $ 33,610 98,671 (646) $ 131,635 $ 23,319 128,842 (492) $ 151,669 $ 24,190 141,833 — $ 166,023 Total Equity/(Deficit) $ 15,071 $ (642) $ (7,782) $ (15,371) $ 7,771 180 Ford Motor Company | 2011 Annual Report
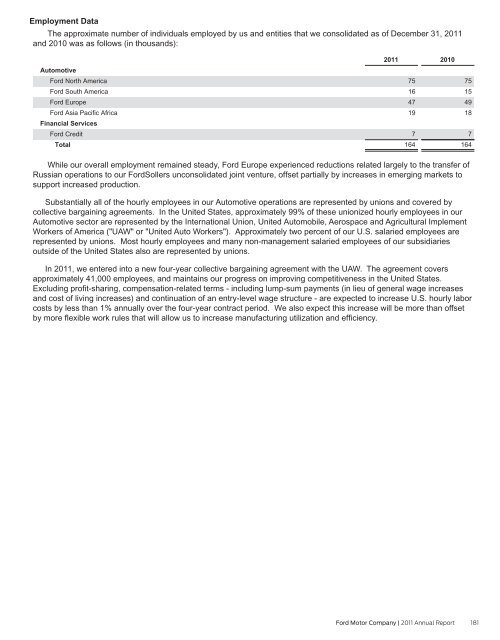
Employment Data The approximate number of individuals employed by us and entities that we consolidated as of December 31, 2011 and 2010 was as follows (in thousands): Automotive Ford North America Ford South America Ford Europe Ford Asia Pacific Africa Financial Services Ford Credit Total 2011 75 16 47 19 7 164 2010 75 15 49 18 7 164 While our overall employment remained steady, Ford Europe experienced reductions related largely to the transfer of Russian operations to our FordSollers unconsolidated joint venture, offset partially by increases in emerging markets to support increased production. Substantially all of the hourly employees in our Automotive operations are represented by unions and covered by collective bargaining agreements. In the United States, approximately 99% of these unionized hourly employees in our Automotive sector are represented by the International Union, United Automobile, Aerospace and Agricultural Implement Workers of America ("UAW" or "United Auto Workers"). Approximately two percent of our U.S. salaried employees are represented by unions. Most hourly employees and many non-management salaried employees of our subsidiaries outside of the United States also are represented by unions. In 2011, we entered into a new four-year collective bargaining agreement with the UAW. The agreement covers approximately 41,000 employees, and maintains our progress on improving competitiveness in the United States. Excluding profit-sharing, compensation-related terms - including lump-sum payments (in lieu of general wage increases and cost of living increases) and continuation of an entry-level wage structure - are expected to increase U.S. hourly labor costs by less than 1% annually over the four-year contract period. We also expect this increase will be more than offset by more flexible work rules that will allow us to increase manufacturing utilization and efficiency. Ford Motor Company | 2011 Annual Report 181