

PROFITABLE GROWTH FOR ALL

You also want an ePaper? Increase the reach of your titles
YUMPU automatically turns print PDFs into web optimized ePapers that Google loves.
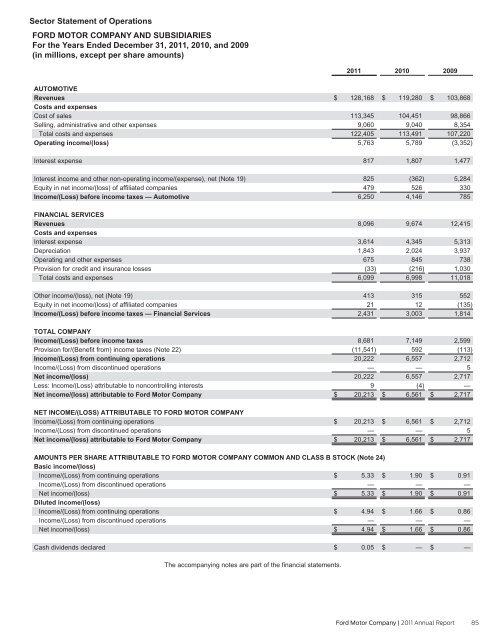
Sector Statement of Operations<br />
<strong>FOR</strong>D MOTOR COMPANY AND SUBSIDIARIES<br />
For the Years Ended December 31, 2011, 2010, and 2009<br />
(in millions, except per share amounts)<br />
2011<br />
2010<br />
2009<br />
AUTOMOTIVE<br />
Revenues<br />
Costs and expenses<br />
Cost of sales<br />
Selling, administrative and other expenses<br />
Total costs and expenses<br />
Operating income/(loss)<br />
$ 128,168<br />
113,345<br />
9,060<br />
122,405<br />
5,763<br />
$ 119,280<br />
104,451<br />
9,040<br />
113,491<br />
5,789<br />
$ 103,868<br />
98,866<br />
8,354<br />
107,220<br />
(3,352)<br />
Interest expense<br />
817<br />
1,807<br />
1,477<br />
Interest income and other non-operating income/(expense), net (Note 19)<br />
Equity in net income/(loss) of affiliated companies<br />
Income/(Loss) before income taxes — Automotive<br />
825<br />
479<br />
6,250<br />
(362)<br />
526<br />
4,146<br />
5,284<br />
330<br />
785<br />
FINANCIAL SERVICES<br />
Revenues<br />
Costs and expenses<br />
Interest expense<br />
Depreciation<br />
Operating and other expenses<br />
Provision for credit and insurance losses<br />
Total costs and expenses<br />
8,096<br />
3,614<br />
1,843<br />
675<br />
(33)<br />
6,099<br />
9,674<br />
4,345<br />
2,024<br />
845<br />
(216)<br />
6,998<br />
12,415<br />
5,313<br />
3,937<br />
738<br />
1,030<br />
11,018<br />
Other income/(loss), net (Note 19)<br />
Equity in net income/(loss) of affiliated companies<br />
Income/(Loss) before income taxes — Financial Services<br />
413<br />
21<br />
2,431<br />
315<br />
12<br />
3,003<br />
552<br />
(135)<br />
1,814<br />
TOTAL COMPANY<br />
Income/(Loss) before income taxes<br />
Provision for/(Benefit from) income taxes (Note 22)<br />
Income/(Loss) from continuing operations<br />
Income/(Loss) from discontinued operations<br />
Net income/(loss)<br />
Less: Income/(Loss) attributable to noncontrolling interests<br />
Net income/(loss) attributable to Ford Motor Company<br />
8,681<br />
(11,541)<br />
20,222<br />
—<br />
20,222<br />
9<br />
$ 20,213<br />
7,149<br />
592<br />
6,557<br />
—<br />
6,557<br />
(4)<br />
$ 6,561<br />
2,599<br />
(113)<br />
2,712<br />
5<br />
2,717<br />
—<br />
$ 2,717<br />
NET INCOME/(LOSS) ATTRIBUTABLE TO <strong>FOR</strong>D MOTOR COMPANY<br />
Income/(Loss) from continuing operations<br />
Income/(Loss) from discontinued operations<br />
Net income/(loss) attributable to Ford Motor Company<br />
$ 20,213<br />
—<br />
$ 20,213<br />
$ 6,561<br />
—<br />
$ 6,561<br />
$ 2,712<br />
5<br />
$ 2,717<br />
AMOUNTS PER SHARE ATTRIBUTABLE TO <strong>FOR</strong>D MOTOR COMPANY COMMON AND CLASS B STOCK (Note 24)<br />
Basic income/(loss)<br />
Income/(Loss) from continuing operations<br />
Income/(Loss) from discontinued operations<br />
Net income/(loss)<br />
Diluted income/(loss)<br />
Income/(Loss) from continuing operations<br />
Income/(Loss) from discontinued operations<br />
Net income/(loss)<br />
$<br />
$<br />
$<br />
$<br />
5.33<br />
—<br />
5.33<br />
4.94<br />
—<br />
4.94<br />
$ 1.90<br />
—<br />
$ 1.90<br />
$ 1.66<br />
—<br />
$ 1.66<br />
$ 0.91<br />
—<br />
$ 0.91<br />
$ 0.86<br />
—<br />
$ 0.86<br />
Cash dividends declared<br />
$ 0.05<br />
$ —<br />
$ —<br />
The accompanying notes are part of the financial statements.<br />
Ford Motor Company | 2011 Annual Report 85