

PROFITABLE GROWTH FOR ALL

Create successful ePaper yourself
Turn your PDF publications into a flip-book with our unique Google optimized e-Paper software.
Management’s Discussion and Analysis of Financial Condition and Results of Operations<br />
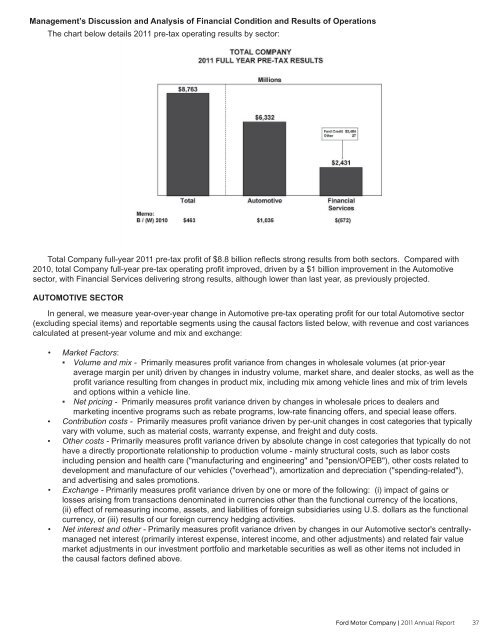
The chart below details 2011 pre-tax operating results by sector:<br />
Total Company full-year 2011 pre-tax profit of $8.8 billion reflects strong results from both sectors. Compared with<br />
2010, total Company full-year pre-tax operating profit improved, driven by a $1 billion improvement in the Automotive<br />
sector, with Financial Services delivering strong results, although lower than last year, as previously projected.<br />
AUTOMOTIVE SECTOR<br />
In general, we measure year-over-year change in Automotive pre-tax operating profit for our total Automotive sector<br />
(excluding special items) and reportable segments using the causal factors listed below, with revenue and cost variances<br />
calculated at present-year volume and mix and exchange:<br />
• Market Factors:<br />
Volume and mix - Primarily measures profit variance from changes in wholesale volumes (at prior-year<br />
average margin per unit) driven by changes in industry volume, market share, and dealer stocks, as well as the<br />
profit variance resulting from changes in product mix, including mix among vehicle lines and mix of trim levels<br />
and options within a vehicle line.<br />
Net pricing - Primarily measures profit variance driven by changes in wholesale prices to dealers and<br />
marketing incentive programs such as rebate programs, low-rate financing offers, and special lease offers.<br />
• Contribution costs - Primarily measures profit variance driven by per-unit changes in cost categories that typically<br />
vary with volume, such as material costs, warranty expense, and freight and duty costs.<br />
• Other costs - Primarily measures profit variance driven by absolute change in cost categories that typically do not<br />
have a directly proportionate relationship to production volume - mainly structural costs, such as labor costs<br />
including pension and health care ("manufacturing and engineering" and "pension/OPEB"), other costs related to<br />
development and manufacture of our vehicles ("overhead"), amortization and depreciation ("spending-related"),<br />
and advertising and sales promotions.<br />
• Exchange - Primarily measures profit variance driven by one or more of the following: (i) impact of gains or<br />
losses arising from transactions denominated in currencies other than the functional currency of the locations,<br />
(ii) effect of remeasuring income, assets, and liabilities of foreign subsidiaries using U.S. dollars as the functional<br />
currency, or (iii) results of our foreign currency hedging activities.<br />
• Net interest and other - Primarily measures profit variance driven by changes in our Automotive sector's centrallymanaged<br />
net interest (primarily interest expense, interest income, and other adjustments) and related fair value<br />
market adjustments in our investment portfolio and marketable securities as well as other items not included in<br />
the causal factors defined above.<br />
Ford Motor Company | 2011 Annual Report 37