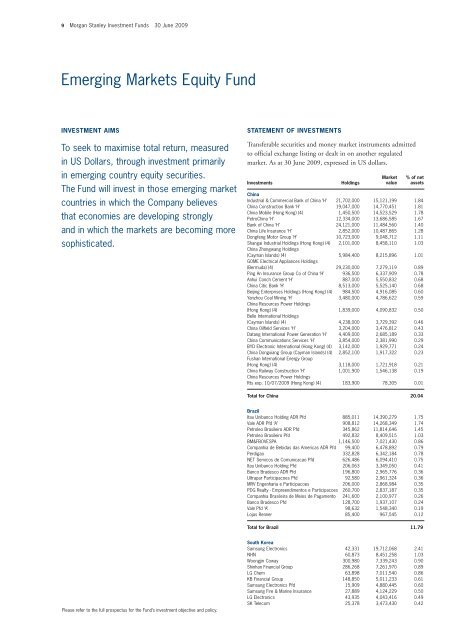
9 <strong>Morgan</strong> <strong>Stanley</strong> <strong>Investment</strong> <strong>Funds</strong> 30 June 2009 Emerging Markets Equity Fund INVESTMENT AIMS To seek to maximise total return, measured in US Dollars, through investment primarily in emerging country equity securities. The Fund will invest in those emerging market countries in which the Company believes that economies are developing strongly and in which the markets are becoming more sophisticated. Please refer to the full prospectus for the Fund’s investment objective and policy. STATEMENT OF INVESTMENTS Transferable securities and money market instruments admitted to official exchange listing or dealt in on another regulated market. As at 30 June 2009, expressed in US dollars. <strong>Investment</strong>s Holdings Market value % of net assets China Industrial & Commercial Bank of China ‘H’ 21,702,000 15,121,199 1.84 China Construction Bank ‘H’ 19,047,000 14,770,451 1.81 China Mobile (Hong Kong) (4) 1,450,500 14,523,529 1.78 PetroChina ‘H’ 12,334,000 13,686,585 1.67 Bank of China ‘H’ 24,121,000 11,484,560 1.40 China Life Insurance ‘H’ 2,852,000 10,487,865 1.28 Dongfeng Motor Group ‘H’ 10,723,000 9,048,712 1.11 Shangai Industrial Holdings (Hong Kong) (4) 2,101,000 8,458,110 1.03 China Zhongwang Holdings (Cayman Islands) (4) 5,984,400 8,215,896 1.01 GOME Electrical Appliances Holdings (Bermuda) (4) 29,230,000 7,279,119 0.89 Ping An Insurance Group Co of China ‘H’ 936,500 6,337,909 0.78 Anhui Conch Cement ‘H’ 887,000 5,550,832 0.68 China Citic Bank ‘H’ 8,513,000 5,525,140 0.68 Beijing Enterprises Holdings (Hong Kong) (4) 984,500 4,916,085 0.60 Yanzhou Coal Mining ‘H’ 3,480,000 4,786,622 0.59 China Resources Power Holdings (Hong Kong) (4) 1,839,000 4,090,832 0.50 Belle International Holdings (Cayman Islands) (4) 4,238,000 3,729,392 0.46 China Oilfield Services ‘H’ 3,204,000 3,476,812 0.43 Datang International Power Generation ‘H’ 4,409,000 2,685,189 0.33 China Communications Services ‘H’ 3,854,000 2,381,990 0.29 BYD Electronic International (Hong Kong) (4) 3,142,000 1,929,771 0.24 China Dongxiang Group (Cayman Islands) (4) 2,852,100 1,917,322 0.23 Fushan International Energy Group (Hong Kong) (4) 3,118,000 1,721,918 0.21 China Railway Construction ‘H’ 1,001,900 1,546,138 0.19 China Resources Power Holdings Rts exp. 10/07/2009 (Hong Kong) (4) 183,900 78,305 0.01 Total for China 20.04 Brazil Itau Unibanco Holding ADR Pfd 885,011 14,390,279 1.75 Vale ADR Pfd ‘A’ 908,812 14,268,349 1.74 Petroleo Brasileiro ADR Pfd 345,862 11,814,646 1.45 Petroleo Brasileiro Pfd 492,832 8,409,515 1.03 BM&FBOVESPA 1,146,500 7,021,430 0.86 Companhia de Bebidas das Americas ADR Pfd 99,400 6,478,892 0.79 Perdigao 332,828 6,342,184 0.78 NET Servicos de Comunicacao Pfd 626,486 6,094,410 0.75 Itau Unibanco Holding Pfd 206,063 3,349,050 0.41 Banco Bradesco ADR Pfd 196,800 2,965,776 0.36 Ultrapar Participacoes Pfd 92,580 2,961,324 0.36 MRV Engenharia e Participacoes 206,000 2,868,984 0.35 PDG Realty - Empreendimentos e Participacoes 260,700 2,837,187 0.35 Companhia Brasileira de Meios de Pagamento 241,600 2,100,977 0.26 Banco Bradesco Pfd 128,700 1,937,107 0.24 Vale Pfd ‘A’ 98,632 1,548,340 0.19 Lojas Renner 85,400 967,545 0.12 Total for Brazil 11.79 South Korea Samsung Electronics 42,331 19,712,068 2.41 NHN 60,873 8,451,258 1.03 Woongjin Coway 300,980 7,339,243 0.90 Shinhan Financial Group 286,268 7,261,970 0.89 LG Chem 63,898 7,011,540 0.86 KB Financial Group 148,850 5,011,233 0.61 Samsung Electronics Pfd 15,909 4,880,445 0.60 Samsung Fire & Marine Insurance 27,889 4,124,229 0.50 LG Electronics 43,935 4,043,416 0.49 SK Telecom 25,378 3,473,430 0.42
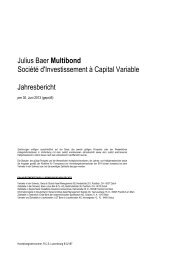
Emerging Markets Equity Fund STATEMENT OF INVESTMENTS (continued) Transferable securities and money market instruments admitted to official exchange listing or dealt in on another regulated market. As at 30 June 2009, expressed in US dollars. <strong>Investment</strong>s Holdings Market value % of net assets South Korea (continued) Cheil Worldwide 18,051 3,322,531 0.41 Shinsegae 8,186 3,251,734 0.40 KT&G 55,190 3,125,682 0.38 Amorepacific 5,786 3,108,502 0.38 Cheil Industries 80,715 2,914,197 0.36 Hyundai Engineering & Construction 64,095 2,692,262 0.33 Hana Financial Group 117,910 2,541,284 0.31 LG Telecom 204,460 1,289,837 0.16 Hyundai Motor 18,330 1,068,397 0.13 SSCP 105,196 643,770 0.08 Total for South Korea 11.65 Taiwan Taiwan Semiconductor Manufacturing 9,091,254 15,156,708 1.86 Hon Hai Precision Industry 4,486,322 13,878,747 1.70 HTC 654,400 9,254,544 1.13 Cathay Financial Holding 5,881,900 8,703,634 1.06 Yuanta Financial Holding 8,380,000 5,644,560 0.69 Wistron 3,329,000 5,529,732 0.68 Taishin Financial Holdings 12,402,000 4,649,333 0.57 Acer 2,547,075 4,432,733 0.54 Fubon Financial Holding 4,659,000 4,359,381 0.53 Siliconware Precision Industries 3,486,000 4,042,740 0.49 Taiwan Fertilizer 1,177,000 3,494,051 0.43 Chunghwa Telecom 1,572,991 3,140,229 0.38 First Financial Holding 3,825,448 2,285,242 0.28 Wistron GDR RegS 33,950 543,200 0.07 Total for Taiwan 10.41 India HDFC Bank 373,855 11,690,505 1.43 Bharat Heavy Electricals 193,747 8,942,996 1.09 State Bank Of India (1) 174,285 6,370,254 0.78 Hero Honda Motors 213,928 6,261,482 0.77 Jaiprakash Associates 1,290,577 5,531,237 0.68 Infosys Technologies 147,740 5,496,547 0.67 <strong>Morgan</strong> <strong>Stanley</strong> Growth Fund 5,372,744 5,374,207 0.66 Axis Bank 290,400 5,061,474 0.62 Unitech 2,878,694 4,801,842 0.59 Hindustan Unilever 843,491 4,725,316 0.58 Union Bank Of India 676,087 3,427,867 0.42 Hindustan Petroleum 445,036 2,786,718 0.34 ITC 516,800 2,064,494 0.25 Maruti Suzuki India 81,325 1,820,573 0.22 Deccan Chronicle Holdings 752,820 1,172,192 0.14 Total for India 9.24 South Africa MTN Group 836,241 12,933,976 1.58 Naspers ‘N’ 314,400 8,224,870 1.01 Impala Platinum Holdings 298,800 6,624,976 0.81 AngloGold Ashanti 141,620 5,358,495 0.66 SABMiller (United Kingdom) (4) 226,927 4,659,183 0.57 Tiger Brands 249,973 4,642,911 0.57 African Bank <strong>Investment</strong>s 1,081,624 3,884,982 0.48 Anglo Platinum 53,551 3,783,845 0.46 Harmony Gold Mining 253,200 2,726,693 0.33 Mr Price Group 723,246 2,713,110 0.33 Sasol 40,027 1,416,464 0.17 AngloGold Ashanti ADR 7,960 300,888 0.04 Total for South Africa 7.01 <strong>Morgan</strong> <strong>Stanley</strong> <strong>Investment</strong> <strong>Funds</strong> 30 June 2009 10 <strong>Investment</strong>s Holdings Market value % of net assets Russia LUKOIL ADR 203,592 9,361,160 1.14 Rosneft Oil GDR 1,294,088 7,324,538 0.89 Gazprom ADR 256,303 5,356,733 0.66 Vimpel-Communications ADR 354,469 4,239,449 0.52 X5 Retail Group GDR RegS (Netherlands) (4) 219,947 3,376,186 0.41 Sberbank 2,531,626 3,240,481 0.40 Wimm-Bill-Dann Foods ADR 54,490 3,067,242 0.38 Polyus Gold ADR 141,284 2,917,515 0.36 RusHydro GDR 558,125 2,115,294 0.26 RusHydro ‘CLS’ 19,676,476 747,717 0.09 Total for Russia 5.11 Mexico America Movil ADR ‘L’ 355,841 13,970,318 1.70 Grupo Televisa ADR ‘CPO’ 381,900 6,606,870 0.81 Grupo Financiero Banorte ‘O’ 2,614,583 6,422,522 0.79 Wal-Mart de Mexico ‘V’ 1,386,109 4,110,090 0.50 Desarrolladora Homex ADR 114,743 3,263,291 0.40 Total for Mexico 4.20 Indonesia PT Bank Central Asia 17,410,000 6,012,270 0.74 PT Bank Mandiri Persero 14,784,500 4,598,657 0.56 Bank Rakyat Indonesia 7,418,500 4,578,648 0.56 PT Astra International 1,902,600 4,436,138 0.54 PT Telekomunikasi Indonesia 4,845,500 3,560,250 0.44 PT Perusahaan Gas Negara 11,327,500 3,495,628 0.43 PT Bumi Resources 8,706,000 1,586,398 0.19 PT Indocement Tunggal Prakarsa 1,918,000 1,456,233 0.18 Total for Indonesia 3.64 Turkey Turkiye Garanti Bankasi 3,191,058 8,665,014 1.07 Akbank 1,150,978 5,183,909 0.63 Anadolu Efes Biracilik Ve Malt Sanayii 358,407 3,251,865 0.40 Turkiye Is Bankasi ‘C’ 1,088,345 3,225,252 0.39 Turkiye Halk Bankasi 707,165 2,792,656 0.34 Turkcell Iletisim Hizmet 493,981 2,789,122 0.34 Turk Telekomunikasyon 552,885 1,717,841 0.21 Haci Omer Sabanci Holding 608,118 1,643,348 0.20 Total for Turkey 3.58 Poland Bank Pekao 191,019 7,044,732 0.85 Powszechna Kasa Oszczednosci Bank Polski 698,447 5,771,414 0.71 Telekomunikacja Polska 553,850 2,745,598 0.34 Bank Zachodni WBK 80,089 2,299,962 0.28 Bank Handlowy w Warszawie 134,956 2,088,866 0.26 Polskie Gornictwo Naftowe I Gazownictwo 1,567,895 2,024,815 0.25 KGHM Polska Miedz 54,152 1,415,761 0.17 Total for Poland 2.86 Czech Republic CEZ 165,258 7,554,549 0.92 Komercni Banka 39,551 5,523,054 0.68 Telefonica O2 Czech Republic 162,767 3,746,849 0.46 Total for Czech Republic 2.06 Thailand Bangkok Bank Public ‘NVDR’ (1) 1,387,200 4,394,767 0.53 Kasikornbank (Foreign) (1) 1,754,586 3,731,519 0.46 Siam Commercial Bank (Foreign) 1,077,800 2,371,223 0.29 PTT Exploration & Production (Foreign) (1) 533,500 2,128,366 0.26 PTT (Foreign) (1) 244,300 1,676,920 0.21 Kasikornbank ‘NVDR’ (1) 862,077 1,675,348 0.20 Total for Thailand 1.95
- Page 1: INVESTMENT MANAGEMENT Morgan Stanle
- Page 4 and 5: 1 Morgan Stanley Investment Funds 3
- Page 6 and 7: 3 Morgan Stanley Investment Funds 3
- Page 8 and 9: 5 Morgan Stanley Investment Funds 3
- Page 10 and 11: 7 Morgan Stanley Investment Funds 3
- Page 14 and 15: 11 Morgan Stanley Investment Funds
- Page 16 and 17: 13 Morgan Stanley Investment Funds
- Page 18 and 19: 15 Morgan Stanley Investment Funds
- Page 20 and 21: 17 Morgan Stanley Investment Funds
- Page 22 and 23: 19 Morgan Stanley Investment Funds
- Page 24 and 25: 21 Morgan Stanley Investment Funds
- Page 26 and 27: 23 Morgan Stanley Investment Funds
- Page 28 and 29: 25 Morgan Stanley Investment Funds
- Page 30 and 31: 27 Morgan Stanley Investment Funds
- Page 32 and 33: 29 Morgan Stanley Investment Funds
- Page 34 and 35: 31 Morgan Stanley Investment Funds
- Page 36 and 37: 33 Morgan Stanley Investment Funds
- Page 38 and 39: 35 Morgan Stanley Investment Funds
- Page 40 and 41: 37 Morgan Stanley Investment Funds
- Page 42 and 43: 39 Morgan Stanley Investment Funds
- Page 44 and 45: 41 Morgan Stanley Investment Funds
- Page 46 and 47: 43 Morgan Stanley Investment Funds
- Page 48 and 49: 45 Morgan Stanley Investment Funds
- Page 50 and 51: 47 Morgan Stanley Investment Funds
- Page 52 and 53: 49 Morgan Stanley Investment Funds
- Page 54 and 55: 51 Morgan Stanley Investment Funds
- Page 56 and 57: 53 Morgan Stanley Investment Funds
- Page 58 and 59: 55 Morgan Stanley Investment Funds
- Page 60 and 61: 57 Morgan Stanley Investment Funds
- Page 62 and 63:
59 Morgan Stanley Investment Funds
- Page 64 and 65:
61 Morgan Stanley Investment Funds
- Page 66 and 67:
63 Morgan Stanley Investment Funds
- Page 68 and 69:
65 Morgan Stanley Investment Funds
- Page 70 and 71:
67 Morgan Stanley Investment Funds
- Page 72 and 73:
69 Morgan Stanley Investment Funds
- Page 74 and 75:
71 Morgan Stanley Investment Funds
- Page 76 and 77:
73 Morgan Stanley Investment Funds
- Page 78 and 79:
75 Morgan Stanley Investment Funds
- Page 80 and 81:
77 Morgan Stanley Investment Funds
- Page 82 and 83:
79 Morgan Stanley Investment Funds
- Page 84 and 85:
81 Morgan Stanley Investment Funds
- Page 86 and 87:
83 Morgan Stanley Investment Funds
- Page 88 and 89:
85 Morgan Stanley Investment Funds
- Page 90 and 91:
87 Morgan Stanley Investment Funds
- Page 92 and 93:
89 Morgan Stanley Investment Funds
- Page 94 and 95:
91 Morgan Stanley Investment Funds
- Page 96 and 97:
93 Morgan Stanley Investment Funds
- Page 98 and 99:
95 Morgan Stanley Investment Funds
- Page 100 and 101:
97 Morgan Stanley Investment Funds
- Page 102 and 103:
99 Morgan Stanley Investment Funds
- Page 104 and 105:
101 Morgan Stanley Investment Funds
- Page 106 and 107:
103 Morgan Stanley Investment Funds
- Page 108 and 109:
105 Morgan Stanley Investment Funds
- Page 110 and 111:
107 Morgan Stanley Investment Funds
- Page 112 and 113:
109 Morgan Stanley Investment Funds
- Page 114 and 115:
111 Morgan Stanley Investment Funds
- Page 116 and 117:
113 Morgan Stanley Investment Funds
- Page 118 and 119:
115 Morgan Stanley Investment Funds
- Page 120 and 121:
117 Morgan Stanley Investment Funds
- Page 122 and 123:
119 Morgan Stanley Investment Funds
- Page 124 and 125:
121 Morgan Stanley Investment Funds
- Page 126 and 127:
123 Morgan Stanley Investment Funds
- Page 128 and 129:
125 Morgan Stanley Investment Funds
- Page 130 and 131:
127 Morgan Stanley Investment Funds
- Page 132 and 133:
129 Morgan Stanley Investment Funds
- Page 134 and 135:
131 Morgan Stanley Investment Funds
- Page 136 and 137:
133 Morgan Stanley Investment Funds
- Page 138 and 139:
135 Morgan Stanley Investment Funds
- Page 140 and 141:
137 Morgan Stanley Investment Funds
- Page 142 and 143:
139 Morgan Stanley Investment Funds
- Page 144 and 145:
141 Morgan Stanley Investment Funds
- Page 146 and 147:
143 Morgan Stanley Investment Funds
- Page 148 and 149:
145 Morgan Stanley Investment Funds
- Page 150 and 151:
147 Morgan Stanley Investment Funds
- Page 152 and 153:
149 Morgan Stanley Investment Funds
- Page 154 and 155:
151 Morgan Stanley Investment Funds
- Page 156 and 157:
153 Morgan Stanley Investment Funds
- Page 158 and 159:
155 Morgan Stanley Investment Funds
- Page 160 and 161:
157 Morgan Stanley Investment Funds
- Page 162 and 163:
159 Morgan Stanley Investment Funds
- Page 164 and 165:
161 Morgan Stanley Investment Funds
- Page 166 and 167:
163 Morgan Stanley Investment Funds
- Page 168 and 169:
165 Morgan Stanley Investment Funds
- Page 170 and 171:
167 Morgan Stanley Investment Funds
- Page 172 and 173:
169 Morgan Stanley Investment Funds
- Page 174 and 175:
171 Morgan Stanley Investment Funds
- Page 176 and 177:
173 Morgan Stanley Investment Funds
- Page 178 and 179:
175 Morgan Stanley Investment Funds
- Page 180 and 181:
177 Morgan Stanley Investment Funds
- Page 182 and 183:
179 Morgan Stanley Investment Funds
- Page 184 and 185:
181 Morgan Stanley Investment Funds
- Page 186 and 187:
183 Morgan Stanley Investment Funds
- Page 188 and 189:
185 Morgan Stanley Investment Funds
- Page 190 and 191:
187 Morgan Stanley Investment Funds
- Page 192 and 193:
189 Morgan Stanley Investment Funds
- Page 196:
www.morganstanleyinvestmentfunds.co