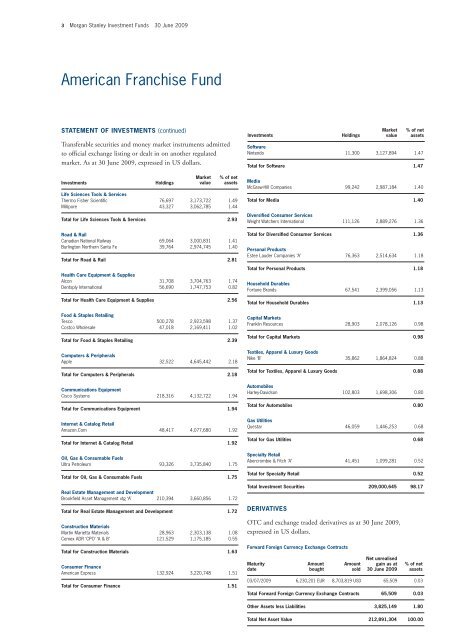
3 <strong>Morgan</strong> <strong>Stanley</strong> <strong>Investment</strong> <strong>Funds</strong> 30 June 2009 American Franchise Fund STATEMENT OF INVESTMENTS (continued) Transferable securities and money market instruments admitted to official exchange listing or dealt in on another regulated market. As at 30 June 2009, expressed in US dollars. <strong>Investment</strong>s Holdings Market value % of net assets Life Sciences Tools & Services Thermo Fisher Scientific 76,697 3,173,722 1.49 Millipore 43,327 3,062,785 1.44 Total for Life Sciences Tools & Services 2.93 Road & Rail Canadian National Railway 69,064 3,000,831 1.41 Burlington Northern Santa Fe 39,764 2,974,745 1.40 Total for Road & Rail 2.81 Health Care Equipment & Supplies Alcon 31,708 3,704,763 1.74 Dentsply International 56,690 1,747,753 0.82 Total for Health Care Equipment & Supplies 2.56 Food & Staples Retailing Tesco 500,278 2,923,598 1.37 Costco Wholesale 47,018 2,169,411 1.02 Total for Food & Staples Retailing 2.39 Computers & Peripherals Apple 32,522 4,645,442 2.18 Total for Computers & Peripherals 2.18 Communications Equipment Cisco Systems 218,316 4,132,722 1.94 Total for Communications Equipment 1.94 Internet & Catalog Retail Amazon.Com 48,417 4,077,680 1.92 Total for Internet & Catalog Retail 1.92 Oil, Gas & Consumable Fuels Ultra Petroleum 93,326 3,735,840 1.75 Total for Oil, Gas & Consumable Fuels 1.75 Real Estate Management and Development Brookfield Asset Management vtg ‘A’ 210,394 3,660,856 1.72 Total for Real Estate Management and Development 1.72 Construction Materials Martin Marietta Materials 28,963 2,303,138 1.08 Cemex ADR ‘CPO’ ‘A & B’ 121,529 1,175,185 0.55 Total for Construction Materials 1.63 Consumer Finance American Express 132,924 3,220,748 1.51 Total for Consumer Finance 1.51 <strong>Investment</strong>s Holdings Software Nintendo 11,300 3,127,894 1.47 Total for Software 1.47 Media McGraw-Hill Companies 99,242 2,987,184 1.40 Total for Media 1.40 Diversified Consumer Services Weight Watchers International 111,126 2,889,276 1.36 Total for Diversified Consumer Services 1.36 Personal Products Estee Lauder Companies ‘A’ 76,363 2,514,634 1.18 Total for Personal Products 1.18 Household Durables Fortune Brands 67,541 2,399,056 1.13 Total for Household Durables 1.13 Capital Markets Franklin Resources 28,903 2,078,126 0.98 Total for Capital Markets 0.98 Textiles, Apparel & Luxury Goods Nike ‘B’ 35,862 1,864,824 0.88 Total for Textiles, Apparel & Luxury Goods 0.88 Automobiles Harley-Davidson 102,803 1,698,306 0.80 Total for Automobiles 0.80 Gas Utilities Questar 46,059 1,446,253 0.68 Total for Gas Utilities 0.68 Specialty Retail Abercrombie & Fitch ‘A’ 41,451 1,099,281 0.52 Total for Specialty Retail 0.52 Total <strong>Investment</strong> Securities 209,000,645 98.17 DERIVATIVES OTC and exchange traded derivatives as at 30 June 2009, expressed in US dollars. Forward Foreign Currency Exchange Contracts Maturity date Amount bought Amount sold Market value Net unrealised gain as at 30 June 2009 % of net assets % of net assets 03/07/2009 6,230,201 EUR 8,703,819 USD 65,509 0.03 Total Forward Foreign Currency Exchange Contracts 65,509 0.03 Other Assets less Liabilities 3,825,149 1.80 Total Net Asset Value 212,891,304 100.00
Asian Equity Fund INVESTMENT AIMS To seek long-term capital appreciation, measured in US Dollars, through investment primarily in the equity securities of companies domiciled in or exercising the predominant part of their economic activity in Asia, excluding Japan, thereby taking advantage of the dynamic economic growth capabilities of the region. Please refer to the full prospectus for the Fund’s investment objective and policy. STATEMENT OF INVESTMENTS <strong>Morgan</strong> <strong>Stanley</strong> <strong>Investment</strong> <strong>Funds</strong> 30 June 2009 4 Transferable securities and money market instruments admitted to official exchange listing or dealt in on another regulated market. As at 30 June 2009, expressed in US dollars. <strong>Investment</strong>s Holdings Market value % of net assets China China Construction Bank ‘H’ 24,568,000 19,051,842 3.64 China Mobile (Hong Kong) (4) 1,848,000 18,503,606 3.54 Industrial & Commercial Bank of China ‘H’ 23,588,000 16,435,298 3.15 PetroChina ‘H’ 13,660,000 15,157,998 2.91 Bank of China ‘H’ 29,054,000 13,833,274 2.65 China Life Insurance ‘H’ 3,472,000 12,767,835 2.45 Dongfeng Motor Group ‘H’ 13,056,000 11,017,437 2.11 Shangai Industrial Holdings (Hong Kong) (4) 2,535,000 10,205,288 1.96 Ping An Insurance Group Co of China ‘H’ 1,475,500 9,985,674 1.91 China Zhongwang Holdings (Cayman Islands) (4) 6,486,800 8,905,634 1.71 GOME Electrical Appliances Holdings (Bermuda) (4) 31,971,144 7,961,743 1.53 China Communications Services ‘H’ 12,552,000 7,757,846 1.49 China Citic Bank ‘H’ 10,491,000 6,808,910 1.31 Anhui Conch Cement ‘H’ 845,000 5,287,996 1.01 Belle International Holdings (Cayman Islands) (4) 5,724,000 5,037,055 0.97 Beijing Enterprises Holdings (Hong Kong) (4) 922,500 4,606,489 0.88 China Resources Power Holdings (Hong Kong) (4) 1,862,000 4,141,996 0.79 China Overseas Land & <strong>Investment</strong> (Hong Kong) (4) 1,613,456 3,747,333 0.72 China Oilfield Services ‘H’ 3,392,000 3,680,820 0.71 Yanzhou Coal Mining ‘H’ 2,424,000 3,334,130 0.64 Sino-Ocean Land Holdings (Hong Kong) (4) 2,873,500 3,288,725 0.63 Datang International Power Generation ‘H’ 4,858,000 2,958,641 0.57 China Dongxiang Group (Cayman Islands) (4) 4,011,500 2,696,728 0.52 Fushan International Energy Group (Hong Kong) (4) 3,644,000 2,012,402 0.39 BYD Electronic International (Hong Kong) (4) 2,572,000 1,579,685 0.30 361 Degrees International (Cayman Islands) (4) 937,000 471,517 0.09 China Resources Power Holdings Rts exp. 10/07/2009 (Hong Kong) (4) 186,200 79,284 0.02 Total for China 38.60 South Korea Samsung Electronics 37,060 17,257,547 3.32 Shinhan Financial Group 297,581 7,548,956 1.45 NHN 54,236 7,529,815 1.44 Woongjin Coway 299,984 7,314,956 1.40 LG Chem 60,379 6,625,400 1.27 KB Financial Group 174,480 5,874,101 1.13 Samsung Electronics Pfd 14,243 4,369,362 0.84 Shinsegae 10,395 4,129,218 0.79 LG Electronics 42,185 3,882,361 0.74 Hyundai Engineering & Construction 81,130 3,407,805 0.65 Amorepacific 6,038 3,243,887 0.62 Hana Financial Group 147,770 3,184,849 0.61 Cheil Worldwide 15,470 2,847,463 0.55 KT&G 46,350 2,625,030 0.50 Samsung Fire & Marine Insurance 16,661 2,463,831 0.47 Cheil Industries 63,384 2,288,465 0.44 SK Telecom 13,602 1,861,675 0.36 LG Telecom 230,760 1,455,750 0.28 SSCP 111,569 682,771 0.13 LG.Philips LCD 1,748 43,724 0.01 Total for South Korea 17.00 Taiwan Taiwan Semiconductor Manufacturing 9,655,461 16,097,340 3.09 Hon Hai Precision Industry 4,409,157 13,640,032 2.62 HTC 651,300 9,210,704 1.77 Cathay Financial Holding 5,608,800 8,299,520 1.59 Acer 3,032,320 5,277,216 1.01 Wistron 2,497,000 4,147,714 0.80 Fubon Financial Holding 3,906,000 3,654,806 0.70 Chunghwa Telecom 1,580,242 3,154,704 0.60
- Page 1: INVESTMENT MANAGEMENT Morgan Stanle
- Page 4 and 5: 1 Morgan Stanley Investment Funds 3
- Page 8 and 9: 5 Morgan Stanley Investment Funds 3
- Page 10 and 11: 7 Morgan Stanley Investment Funds 3
- Page 12 and 13: 9 Morgan Stanley Investment Funds 3
- Page 14 and 15: 11 Morgan Stanley Investment Funds
- Page 16 and 17: 13 Morgan Stanley Investment Funds
- Page 18 and 19: 15 Morgan Stanley Investment Funds
- Page 20 and 21: 17 Morgan Stanley Investment Funds
- Page 22 and 23: 19 Morgan Stanley Investment Funds
- Page 24 and 25: 21 Morgan Stanley Investment Funds
- Page 26 and 27: 23 Morgan Stanley Investment Funds
- Page 28 and 29: 25 Morgan Stanley Investment Funds
- Page 30 and 31: 27 Morgan Stanley Investment Funds
- Page 32 and 33: 29 Morgan Stanley Investment Funds
- Page 34 and 35: 31 Morgan Stanley Investment Funds
- Page 36 and 37: 33 Morgan Stanley Investment Funds
- Page 38 and 39: 35 Morgan Stanley Investment Funds
- Page 40 and 41: 37 Morgan Stanley Investment Funds
- Page 42 and 43: 39 Morgan Stanley Investment Funds
- Page 44 and 45: 41 Morgan Stanley Investment Funds
- Page 46 and 47: 43 Morgan Stanley Investment Funds
- Page 48 and 49: 45 Morgan Stanley Investment Funds
- Page 50 and 51: 47 Morgan Stanley Investment Funds
- Page 52 and 53: 49 Morgan Stanley Investment Funds
- Page 54 and 55: 51 Morgan Stanley Investment Funds
- Page 56 and 57:
53 Morgan Stanley Investment Funds
- Page 58 and 59:
55 Morgan Stanley Investment Funds
- Page 60 and 61:
57 Morgan Stanley Investment Funds
- Page 62 and 63:
59 Morgan Stanley Investment Funds
- Page 64 and 65:
61 Morgan Stanley Investment Funds
- Page 66 and 67:
63 Morgan Stanley Investment Funds
- Page 68 and 69:
65 Morgan Stanley Investment Funds
- Page 70 and 71:
67 Morgan Stanley Investment Funds
- Page 72 and 73:
69 Morgan Stanley Investment Funds
- Page 74 and 75:
71 Morgan Stanley Investment Funds
- Page 76 and 77:
73 Morgan Stanley Investment Funds
- Page 78 and 79:
75 Morgan Stanley Investment Funds
- Page 80 and 81:
77 Morgan Stanley Investment Funds
- Page 82 and 83:
79 Morgan Stanley Investment Funds
- Page 84 and 85:
81 Morgan Stanley Investment Funds
- Page 86 and 87:
83 Morgan Stanley Investment Funds
- Page 88 and 89:
85 Morgan Stanley Investment Funds
- Page 90 and 91:
87 Morgan Stanley Investment Funds
- Page 92 and 93:
89 Morgan Stanley Investment Funds
- Page 94 and 95:
91 Morgan Stanley Investment Funds
- Page 96 and 97:
93 Morgan Stanley Investment Funds
- Page 98 and 99:
95 Morgan Stanley Investment Funds
- Page 100 and 101:
97 Morgan Stanley Investment Funds
- Page 102 and 103:
99 Morgan Stanley Investment Funds
- Page 104 and 105:
101 Morgan Stanley Investment Funds
- Page 106 and 107:
103 Morgan Stanley Investment Funds
- Page 108 and 109:
105 Morgan Stanley Investment Funds
- Page 110 and 111:
107 Morgan Stanley Investment Funds
- Page 112 and 113:
109 Morgan Stanley Investment Funds
- Page 114 and 115:
111 Morgan Stanley Investment Funds
- Page 116 and 117:
113 Morgan Stanley Investment Funds
- Page 118 and 119:
115 Morgan Stanley Investment Funds
- Page 120 and 121:
117 Morgan Stanley Investment Funds
- Page 122 and 123:
119 Morgan Stanley Investment Funds
- Page 124 and 125:
121 Morgan Stanley Investment Funds
- Page 126 and 127:
123 Morgan Stanley Investment Funds
- Page 128 and 129:
125 Morgan Stanley Investment Funds
- Page 130 and 131:
127 Morgan Stanley Investment Funds
- Page 132 and 133:
129 Morgan Stanley Investment Funds
- Page 134 and 135:
131 Morgan Stanley Investment Funds
- Page 136 and 137:
133 Morgan Stanley Investment Funds
- Page 138 and 139:
135 Morgan Stanley Investment Funds
- Page 140 and 141:
137 Morgan Stanley Investment Funds
- Page 142 and 143:
139 Morgan Stanley Investment Funds
- Page 144 and 145:
141 Morgan Stanley Investment Funds
- Page 146 and 147:
143 Morgan Stanley Investment Funds
- Page 148 and 149:
145 Morgan Stanley Investment Funds
- Page 150 and 151:
147 Morgan Stanley Investment Funds
- Page 152 and 153:
149 Morgan Stanley Investment Funds
- Page 154 and 155:
151 Morgan Stanley Investment Funds
- Page 156 and 157:
153 Morgan Stanley Investment Funds
- Page 158 and 159:
155 Morgan Stanley Investment Funds
- Page 160 and 161:
157 Morgan Stanley Investment Funds
- Page 162 and 163:
159 Morgan Stanley Investment Funds
- Page 164 and 165:
161 Morgan Stanley Investment Funds
- Page 166 and 167:
163 Morgan Stanley Investment Funds
- Page 168 and 169:
165 Morgan Stanley Investment Funds
- Page 170 and 171:
167 Morgan Stanley Investment Funds
- Page 172 and 173:
169 Morgan Stanley Investment Funds
- Page 174 and 175:
171 Morgan Stanley Investment Funds
- Page 176 and 177:
173 Morgan Stanley Investment Funds
- Page 178 and 179:
175 Morgan Stanley Investment Funds
- Page 180 and 181:
177 Morgan Stanley Investment Funds
- Page 182 and 183:
179 Morgan Stanley Investment Funds
- Page 184 and 185:
181 Morgan Stanley Investment Funds
- Page 186 and 187:
183 Morgan Stanley Investment Funds
- Page 188 and 189:
185 Morgan Stanley Investment Funds
- Page 190 and 191:
187 Morgan Stanley Investment Funds
- Page 192 and 193:
189 Morgan Stanley Investment Funds
- Page 196:
www.morganstanleyinvestmentfunds.co