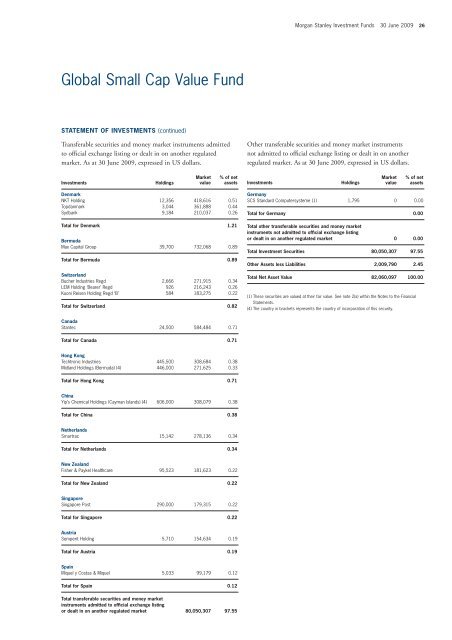
25 <strong>Morgan</strong> <strong>Stanley</strong> <strong>Investment</strong> <strong>Funds</strong> 30 June 2009 Global Small Cap Value Fund STATEMENT OF INVESTMENTS (continued) Transferable securities and money market instruments admitted to official exchange listing or dealt in on another regulated market. As at 30 June 2009, expressed in US dollars. <strong>Investment</strong>s Holdings Market value % of net assets United States of America (continued) Cognex 9,900 141,669 0.17 HEICO ‘A’ 4,200 126,168 0.15 Albany International ‘A’ 5,755 65,895 0.08 Total for United States of America 47.36 Japan Japan Securities Finance 165,408 1,399,532 1.71 Fuyo General Lease 41,900 936,386 1.14 Tokyo Tomin Bank 46,319 889,741 1.08 Yachiyo Bank 26,700 849,249 1.03 Fuji Machine Manufacturing 65,100 788,332 0.96 Shinkawa 55,300 744,384 0.91 Jaccs 301,000 672,678 0.82 Ohara 44,000 624,292 0.76 Taiheiyo Cement 339,000 584,938 0.71 Leopalace21 63,900 572,546 0.70 TOC 127,500 557,949 0.68 Daibiru 64,500 557,138 0.68 Toei Animation 31,800 548,703 0.67 Miraial 25,900 538,434 0.66 THK 32,000 479,975 0.58 Union Tool 17,400 456,681 0.56 Nakanishi 6,014 443,838 0.54 Hikari Tsushin 19,381 438,165 0.53 Sumitomo Osaka Cement 194,030 421,519 0.51 Axell 108 385,053 0.47 Mori Seiki 36,500 381,295 0.46 Sawada Holdings 71,200 299,735 0.37 Sun Frontier Fudousan 987 295,366 0.36 Vantec Group Holdings 277 258,846 0.32 Disco 5,400 230,134 0.28 St Marc Holdings 7,300 227,639 0.28 Maxvalu Tokai 17,800 217,400 0.26 CKD 39,100 199,961 0.24 Okinawa Cellular Telephone 111 191,529 0.23 Harmonic Drive Systems 75 174,471 0.21 Nihon Trim 8,450 168,728 0.21 Ozeki 4,500 126,527 0.15 Osaki Engineering 104 121,075 0.15 Nihon Micro Coating 46,800 115,778 0.14 Alpha Systems 4,700 104,059 0.13 Fujimi 500 8,144 0.01 Total for Japan 19.50 United Kingdom Britvic 179,606 843,753 1.03 Wincanton 258,967 826,030 1.01 Premier Foods 1,235,688 750,516 0.91 Spectris 48,474 451,837 0.55 Wolseley 23,397 445,845 0.54 SIG 267,427 429,822 0.52 Informa (Jersey) (4) 116,778 425,563 0.52 CVS Group 171,852 408,989 0.50 Chemring Group 11,036 397,615 0.48 Bodycote 165,640 363,407 0.44 Home Retail Group 83,707 359,691 0.44 Luminar Group Holdings 189,841 357,675 0.44 Filtrona 137,590 281,401 0.34 Spirax-Sarco Engineering 19,916 281,096 0.34 IMI 48,315 253,125 0.31 Tate & Lyle 38,803 207,139 0.25 Dignity 20,058 199,231 0.24 Catlin Group (Bermuda) (4) 31,952 170,435 0.21 Smurfit Kappa Group (Ireland) (4) 19,053 103,853 0.13 Ark Therapeutics Group 137,608 100,635 0.12 Rotork 6,869 94,963 0.12 Total for United Kingdom 9.44 <strong>Investment</strong>s Holdings Market value % of net assets Ireland Glanbia 218,509 705,240 0.85 Kerry Group ‘A’ 23,990 547,027 0.67 Icon ADR 24,500 538,510 0.66 FBD Holdings 33,132 337,461 0.41 Smurfit Kappa Group 59,829 325,060 0.40 Glanbia 15,298 50,171 0.06 Total for Ireland 3.05 Italy Prysmian 27,941 422,780 0.52 Buzzi Unicem 28,666 416,803 0.51 Davide Campari-Milano 44,077 356,733 0.43 Interpump Group 59,142 293,024 0.36 Brembo 42,395 253,014 0.31 SAES Getters 17,584 157,784 0.19 Total for Italy 2.32 Norway Schibsted 43,992 405,749 0.49 Fred Olsen Energy 11,668 400,615 0.49 Pronova BioPharma 114,691 315,742 0.38 TGS Nopec Geophysical 27,275 275,321 0.34 ProSafe (Cyprus) (4) 37,476 192,352 0.23 Schibsted Rts exp. 2/07/2009 41,114 95,920 0.12 Total for Norway 2.05 Finland Rautaruukki 20,812 431,207 0.53 Konecranes 17,423 418,375 0.51 Uponor 29,464 355,001 0.43 UPM-Kymmene 35,800 319,474 0.39 Total for Finland 1.86 Sweden Saab ‘B’ 75,967 591,735 0.73 Getinge ‘B’ 23,012 305,470 0.37 SKF ‘B’ 23,428 291,223 0.35 Intrum Justitia 21,555 207,776 0.25 Total for Sweden 1.70 Australia Boral 128,205 422,497 0.51 Goodman Fielder 299,854 316,843 0.39 Pacific Brands 457,240 316,544 0.39 Infomedia 799,642 191,004 0.23 Total for Australia 1.52 France Euler Hermes 6,849 418,197 0.52 Teleperformance 11,611 354,318 0.43 Bull 94,839 257,637 0.31 ICADE 2,186 180,553 0.22 Total for France 1.48 Germany GFK 21,486 451,220 0.55 MTU Aero Engines Holding 10,860 406,607 0.50 Sartorius Pfd 15,654 204,914 0.25 Alstria Office 16,545 131,577 0.16 Total for Germany 1.46
Global Small Cap Value Fund STATEMENT OF INVESTMENTS (continued) Transferable securities and money market instruments admitted to official exchange listing or dealt in on another regulated market. As at 30 June 2009, expressed in US dollars. <strong>Investment</strong>s Holdings Market value Denmark NKT Holding 12,356 418,616 0.51 Topdanmark 3,044 361,888 0.44 Sydbank 9,184 210,037 0.26 Total for Denmark 1.21 Bermuda Max Capital Group 39,700 732,068 0.89 Total for Bermuda 0.89 Switzerland Bucher Industries Regd 2,666 271,915 0.34 LEM Holding ‘Bearer’ Regd 926 216,243 0.26 Kuoni Reisen Holding Regd ‘B’ 584 183,275 0.22 Total for Switzerland 0.82 Canada Stantec 24,500 584,484 0.71 Total for Canada 0.71 Hong Kong Techtronic Industries 445,500 308,684 0.38 Midland Holdings (Bermuda) (4) 446,000 271,625 0.33 Total for Hong Kong 0.71 China Yip’s Chemical Holdings (Cayman Islands) (4) 606,000 308,079 0.38 Total for China 0.38 Netherlands Smartrac 15,142 278,136 0.34 Total for Netherlands 0.34 New Zealand Fisher & Paykel Healthcare 95,523 181,623 0.22 Total for New Zealand 0.22 Singapore Singapore Post 290,000 179,315 0.22 Total for Singapore 0.22 Austria Semperit Holding 5,710 154,634 0.19 Total for Austria 0.19 Spain Miquel y Costas & Miquel 5,033 99,179 0.12 Total for Spain 0.12 Total transferable securities and money market instruments admitted to official exchange listing or dealt in on another regulated market 80,050,307 97.55 <strong>Morgan</strong> <strong>Stanley</strong> <strong>Investment</strong> <strong>Funds</strong> 30 June 2009 26 Other transferable securities and money market instruments not admitted to official exchange listing or dealt in on another regulated market. As at 30 June 2009, expressed in US dollars. % of net assets <strong>Investment</strong>s Holdings Market value % of net assets Germany SCS Standard Computersysteme (1) 1,795 0 0.00 Total for Germany 0.00 Total other transferable securities and money market instruments not admitted to official exchange listing or dealt in on another regulated market 0 0.00 Total <strong>Investment</strong> Securities 80,050,307 97.55 Other Assets less Liabilities 2,009,790 2.45 Total Net Asset Value 82,060,097 100.00 (1) These securities are valued at their fair value. See note 2(a) within the Notes to the Financial Statements. (4) The country in brackets represents the country of incorporation of this security.