Cranfield University
Cranfield University
Cranfield University
You also want an ePaper? Increase the reach of your titles
YUMPU automatically turns print PDFs into web optimized ePapers that Google loves.
List of Figures and Tables<br />
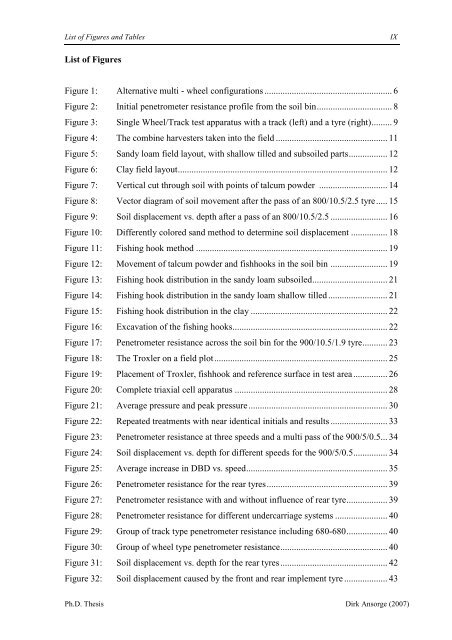
List of Figures<br />
Figure 1: Alternative multi - wheel configurations ........................................................ 6<br />
Figure 2: Initial penetrometer resistance profile from the soil bin................................. 8<br />
Figure 3: Single Wheel/Track test apparatus with a track (left) and a tyre (right)......... 9<br />
Figure 4: The combine harvesters taken into the field ................................................. 11<br />
Figure 5: Sandy loam field layout, with shallow tilled and subsoiled parts................. 12<br />
Figure 6: Clay field layout............................................................................................ 12<br />
Figure 7: Vertical cut through soil with points of talcum powder .............................. 14<br />
Figure 8: Vector diagram of soil movement after the pass of an 800/10.5/2.5 tyre..... 15<br />
Figure 9: Soil displacement vs. depth after a pass of an 800/10.5/2.5 ......................... 16<br />
Figure 10: Differently colored sand method to determine soil displacement ................ 18<br />
Figure 11: Fishing hook method .................................................................................... 19<br />
Figure 12: Movement of talcum powder and fishhooks in the soil bin ......................... 19<br />
Figure 13: Fishing hook distribution in the sandy loam subsoiled................................. 21<br />
Figure 14: Fishing hook distribution in the sandy loam shallow tilled .......................... 21<br />
Figure 15: Fishing hook distribution in the clay ............................................................ 22<br />
Figure 16: Excavation of the fishing hooks.................................................................... 22<br />
Figure 17: Penetrometer resistance across the soil bin for the 900/10.5/1.9 tyre........... 23<br />
Figure 18: The Troxler on a field plot............................................................................ 25<br />
Figure 19: Placement of Troxler, fishhook and reference surface in test area............... 26<br />
Figure 20: Complete triaxial cell apparatus ................................................................... 28<br />
Figure 21: Average pressure and peak pressure............................................................. 30<br />
Figure 22: Repeated treatments with near identical initials and results ......................... 33<br />
Figure 23: Penetrometer resistance at three speeds and a multi pass of the 900/5/0.5... 34<br />
Figure 24: Soil displacement vs. depth for different speeds for the 900/5/0.5............... 34<br />
Figure 25: Average increase in DBD vs. speed.............................................................. 35<br />
Figure 26: Penetrometer resistance for the rear tyres..................................................... 39<br />
Figure 27: Penetrometer resistance with and without influence of rear tyre.................. 39<br />
Figure 28: Penetrometer resistance for different undercarriage systems ....................... 40<br />
Figure 29: Group of track type penetrometer resistance including 680-680.................. 40<br />
Figure 30: Group of wheel type penetrometer resistance............................................... 40<br />
Figure 31: Soil displacement vs. depth for the rear tyres............................................... 42<br />
Figure 32: Soil displacement caused by the front and rear implement tyre ................... 43<br />
Ph.D. Thesis Dirk Ansorge (2007)<br />
IX


