

Cranfield University
Cranfield University
Cranfield University

You also want an ePaper? Increase the reach of your titles
YUMPU automatically turns print PDFs into web optimized ePapers that Google loves.
Ancillary Experiments<br />
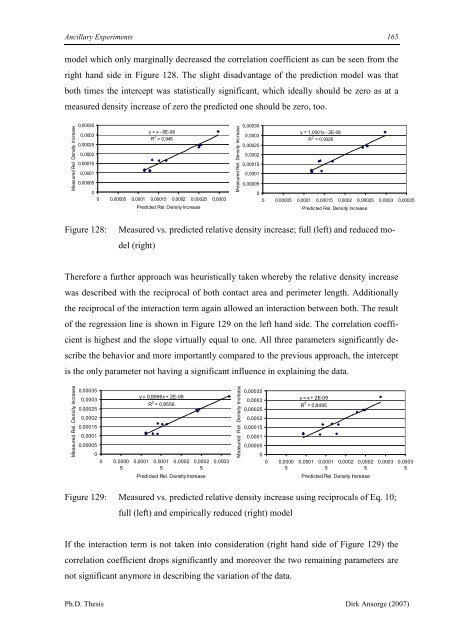
model which only marginally decreased the correlation coefficient as can be seen from the<br />
right hand side in Figure 128. The slight disadvantage of the prediction model was that<br />
both times the intercept was statistically significant, which ideally should be zero as at a<br />
measured density increase of zero the predicted one should be zero, too.<br />
Measured Rel. Density Increase<br />
0,00035<br />
0,0003<br />
0,00025<br />
0,0002<br />
0,00015<br />
0,0001<br />
0,00005<br />
y = x - 6E-08<br />
R 2 y = x - 6E-08<br />
R = 0,945<br />
2 = 0,945<br />
0<br />
0 0,00005 0,0001 0,00015 0,0002 0,00025 0,0003 0,00035<br />
Predicted Rel. Density Increase<br />
Measured Rel. Density Increase<br />
0,00035<br />
0,0003<br />
0,00025<br />
0,0002<br />
0,00015<br />
0,0001<br />
0,00005<br />
y = 1,0001x - 2E-08<br />
R 2 y = 1,0001x - 2E-08<br />
R = 0,9326<br />
2 = 0,9326<br />
Ph.D. Thesis Dirk Ansorge (2007)<br />
165<br />
0<br />
0 0,00005 0,0001 0,00015 0,0002 0,00025 0,0003 0,00035<br />
Predicted Rel. Density Increase<br />
Figure 128: Measured vs. predicted relative density increase; full (left) and reduced mo-<br />
del (right)<br />
Therefore a further approach was heuristically taken whereby the relative density increase<br />
was described with the reciprocal of both contact area and perimeter length. Additionally<br />
the reciprocal of the interaction term again allowed an interaction between both. The result<br />
of the regression line is shown in Figure 129 on the left hand side. The correlation coeffi-<br />
cient is highest and the slope virtually equal to one. All three parameters significantly de-<br />
scribe the behavior and more importantly compared to the previous approach, the intercept<br />
is the only parameter not having a significant influence in explaining the data.<br />
Measured Rel. Density Increase<br />
0,00035<br />
0,0003<br />
0,00025<br />
0,0002<br />
0,00015<br />
0,0001<br />
0,00005<br />
y = 0,9996x+ 2E-08<br />
R 2 R = 0,9556<br />
2 = 0,9556<br />
0<br />
0 0,0000 0,0001 0,0001 0,0002 0,0002 0,0003 0,0003<br />
5<br />
5<br />
5<br />
5<br />
Predicted Rel. Density Increase<br />
Measured Measured Rel. Density Increase<br />
0,00035<br />
0,0003<br />
0,00025<br />
0,0002<br />
0,00015<br />
0,0001<br />
0,00005<br />
y = x + 2E-09<br />
R 2 R = 0,8495<br />
2 = 0,8495<br />
0<br />
0 0,0000 0,0001 0,0001 0,0002 0,0002 0,0003 0,0003<br />
5<br />
5<br />
5<br />
5<br />
Predicted Rel. Density Increase<br />
Figure 129: Measured vs. predicted relative density increase using reciprocals of Eq. 10;<br />
full (left) and empirically reduced (right) model<br />
If the interaction term is not taken into consideration (right hand side of Figure 129) the<br />
correlation coefficient drops significantly and moreover the two remaining parameters are<br />
not significant anymore in describing the variation of the data.


