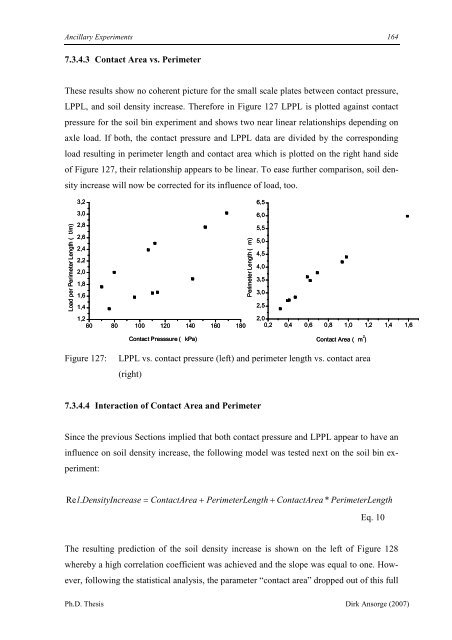
Ancillary Experiments 7.3.4.3 Contact Area vs. Perimeter These results show no coherent picture for the small scale plates between contact pressure, LPPL, and soil density increase. Therefore in Figure 127 LPPL is plotted against contact pressure for the soil bin experiment and shows two near linear relationships depending on axle load. If both, the contact pressure and LPPL data are divided by the corresponding load resulting in perimeter length and contact area which is plotted on the right hand side of Figure 127, their relationship appears to be linear. To ease further comparison, soil den- sity increase will now be corrected for its influence of load, too. Load per Perimeter Length (t/m) 3,2 3,0 2,8 2,6 2,4 2,2 2,0 1,8 1,6 1,4 1,2 60 80 100 120 140 160 180 Contact Presssure (kPa) Ph.D. Thesis Dirk Ansorge (2007) Perimeter Length (m) 6,5 6,0 5,5 5,0 4,5 4,0 3,5 3,0 2,5 164 2,0 0,2 0,4 0,6 0,8 1,0 1,2 1,4 1,6 Contact Area (m 2 Contact Area (m ) 2 ) Figure 127: LPPL vs. contact pressure (left) and perimeter length vs. contact area (right) 7.3.4.4 Interaction of Contact Area and Perimeter Since the previous Sections implied that both contact pressure and LPPL appear to have an influence on soil density increase, the following model was tested next on the soil bin ex- periment: Rel . DensityIncrease � ContactArea � PerimeterLength � ContactArea * PerimeterLength Eq. 10 The resulting prediction of the soil density increase is shown on the left of Figure 128 whereby a high correlation coefficient was achieved and the slope was equal to one. How- ever, following the statistical analysis, the parameter “contact area” dropped out of this full
Ancillary Experiments model which only marginally decreased the correlation coefficient as can be seen from the right hand side in Figure 128. The slight disadvantage of the prediction model was that both times the intercept was statistically significant, which ideally should be zero as at a measured density increase of zero the predicted one should be zero, too. Measured Rel. Density Increase 0,00035 0,0003 0,00025 0,0002 0,00015 0,0001 0,00005 y = x - 6E-08 R 2 y = x - 6E-08 R = 0,945 2 = 0,945 0 0 0,00005 0,0001 0,00015 0,0002 0,00025 0,0003 0,00035 Predicted Rel. Density Increase Measured Rel. Density Increase 0,00035 0,0003 0,00025 0,0002 0,00015 0,0001 0,00005 y = 1,0001x - 2E-08 R 2 y = 1,0001x - 2E-08 R = 0,9326 2 = 0,9326 Ph.D. Thesis Dirk Ansorge (2007) 165 0 0 0,00005 0,0001 0,00015 0,0002 0,00025 0,0003 0,00035 Predicted Rel. Density Increase Figure 128: Measured vs. predicted relative density increase; full (left) and reduced mo- del (right) Therefore a further approach was heuristically taken whereby the relative density increase was described with the reciprocal of both contact area and perimeter length. Additionally the reciprocal of the interaction term again allowed an interaction between both. The result of the regression line is shown in Figure 129 on the left hand side. The correlation coeffi- cient is highest and the slope virtually equal to one. All three parameters significantly de- scribe the behavior and more importantly compared to the previous approach, the intercept is the only parameter not having a significant influence in explaining the data. Measured Rel. Density Increase 0,00035 0,0003 0,00025 0,0002 0,00015 0,0001 0,00005 y = 0,9996x+ 2E-08 R 2 R = 0,9556 2 = 0,9556 0 0 0,0000 0,0001 0,0001 0,0002 0,0002 0,0003 0,0003 5 5 5 5 Predicted Rel. Density Increase Measured Measured Rel. Density Increase 0,00035 0,0003 0,00025 0,0002 0,00015 0,0001 0,00005 y = x + 2E-09 R 2 R = 0,8495 2 = 0,8495 0 0 0,0000 0,0001 0,0001 0,0002 0,0002 0,0003 0,0003 5 5 5 5 Predicted Rel. Density Increase Figure 129: Measured vs. predicted relative density increase using reciprocals of Eq. 10; full (left) and empirically reduced (right) model If the interaction term is not taken into consideration (right hand side of Figure 129) the correlation coefficient drops significantly and moreover the two remaining parameters are not significant anymore in describing the variation of the data.
- Page 1 and 2:
Cranfield University School of Appl
- Page 3 and 4:
Abstract Ancillary experiments show
- Page 5 and 6:
Table of Contents TABLE OF CONTENTS
- Page 7 and 8:
Table of Contents 4.1.3 Analysis of
- Page 9 and 10:
Table of Contents 11.1.1.1 Comparis
- Page 11 and 12:
List of Figures and Tables Figure 3
- Page 13 and 14:
List of Figures and Tables Figure 1
- Page 15 and 16:
Nomenclature NOMENCLATURE Abbreviat
- Page 17 and 18:
Introduction 1 INTRODUCTION 1.1 Bac
- Page 19 and 20:
Introduction � Ansorge, D. and Go
- Page 21 and 22:
Introduction 1.2 Aim To elucidate t
- Page 23 and 24:
Introduction a) the soil compaction
- Page 25 and 26:
Experimental Methods 2.1.1.1 Test F
- Page 27 and 28:
Experimental Methods had been mount
- Page 29 and 30:
Experimental Methods track; the loa
- Page 31 and 32:
Experimental Methods 800/10.5/2.5 t
- Page 33 and 34:
Experimental Methods term. In the m
- Page 35 and 36:
Experimental Methods Soil Surface F
- Page 37 and 38:
Experimental Methods Depth (cm) 0 1
- Page 39 and 40:
Experimental Methods ence surface c
- Page 41 and 42:
Experimental Methods chine derives
- Page 43 and 44:
Experimental Methods depth. The dat
- Page 45 and 46:
Experimental Methods with water and
- Page 47 and 48:
Experimental Methods 2.4 Statistica
- Page 49 and 50:
Laboratory Studies Into Undercarria
- Page 51 and 52:
Laboratory Studies Into Undercarria
- Page 53 and 54:
Laboratory Studies Into Undercarria
- Page 55 and 56:
Laboratory Studies Into Undercarria
- Page 57 and 58:
Laboratory Studies Into Undercarria
- Page 59 and 60:
Laboratory Studies Into Undercarria
- Page 61 and 62:
Laboratory Studies Into Undercarria
- Page 63 and 64:
Laboratory Studies Into Undercarria
- Page 65 and 66:
Laboratory Studies Into Undercarria
- Page 67 and 68:
Laboratory Studies Into Undercarria
- Page 69 and 70:
Laboratory Studies Into Undercarria
- Page 71 and 72:
Laboratory Studies Into Undercarria
- Page 73 and 74:
Laboratory Studies Into Undercarria
- Page 75 and 76:
Laboratory Studies Into Undercarria
- Page 77 and 78:
Field Study With Full Size Combine
- Page 79 and 80:
Field Study With Full Size Combine
- Page 81 and 82:
Field Study With Full Size Combine
- Page 83 and 84:
Field Study With Full Size Combine
- Page 85 and 86:
Field Study With Full Size Combine
- Page 87 and 88:
Field Study With Full Size Combine
- Page 89 and 90:
Field Study With Full Size Combine
- Page 91 and 92:
Field Study With Full Size Combine
- Page 93 and 94:
Field Study With Full Size Combine
- Page 95 and 96:
Field Study With Full Size Combine
- Page 97 and 98:
Field Study With Full Size Combine
- Page 99 and 100:
Alleviation of Soil Compaction Howe
- Page 101 and 102:
Alleviation of Soil Compaction not
- Page 103 and 104:
Alleviation of Soil Compaction in a
- Page 105 and 106:
Alleviation of Soil Compaction diff
- Page 107 and 108:
Soil Compaction Models sibilities t
- Page 109 and 110:
Soil Compaction Models depends on t
- Page 111 and 112:
Soil Compaction Models Wroth (1968)
- Page 113 and 114:
Soil Compaction Models however, the
- Page 115 and 116:
Soil Compaction Models level. Criti
- Page 117 and 118:
Soil Compaction Models Utilizing Ke
- Page 119 and 120:
Soil Compaction Models average of m
- Page 121 and 122:
Soil Compaction Models Depth (mm) -
- Page 123 and 124:
Soil Compaction Models ture content
- Page 125 and 126:
Soil Compaction Models with four ot
- Page 127 and 128:
Soil Compaction Models Predicted In
- Page 129 and 130: Soil Compaction Models Depth (mm) -
- Page 131 and 132: Soil Compaction Models and 13.7 % b
- Page 133 and 134: Soil Compaction Models Rel. Density
- Page 135 and 136: Soil Compaction Models VCL paramete
- Page 137 and 138: Soil Compaction Models The approach
- Page 139 and 140: Soil Compaction Models surface stay
- Page 141 and 142: Soil Compaction Models This result
- Page 143 and 144: Soil Compaction Models 6.6.1.3 Wate
- Page 145 and 146: Soil Compaction Models σσ 1 (kPA)
- Page 147 and 148: Soil Compaction Models pressure to
- Page 149 and 150: Soil Compaction Models The response
- Page 151 and 152: Soil Compaction Models On medium so
- Page 153 and 154: Soil Compaction Models SOILFLEX tak
- Page 155 and 156: Ancillary Experiments 7 ANCILLARY E
- Page 157 and 158: Ancillary Experiments Average conta
- Page 159 and 160: Ancillary Experiments In order to c
- Page 161 and 162: Ancillary Experiments contrary, the
- Page 163 and 164: Ancillary Experiments Figure 102: S
- Page 165 and 166: Ancillary Experiments track and the
- Page 167 and 168: Ancillary Experiments even when hav
- Page 169 and 170: Ancillary Experiments 7.3.2 Influen
- Page 171 and 172: Ancillary Experiments The results f
- Page 173 and 174: Ancillary Experiments Figure 117: S
- Page 175 and 176: Ancillary Experiments Contact Press
- Page 177 and 178: Ancillary Experiments Figure 123: F
- Page 179: Ancillary Experiments Sinkage (mm)
- Page 183 and 184: Ancillary Experiments 7.3.5 The Inf
- Page 185 and 186: Ancillary Experiments 7.3.7 Discuss
- Page 187 and 188: Ancillary Experiments Terzaghi (194
- Page 189 and 190: Ancillary Experiments contact area.
- Page 191 and 192: Ancillary Experiments soil forward
- Page 193 and 194: Conclusions � The longitudinal so
- Page 195 and 196: Bibliography 10 BIBLIOGRAPHY Aboaba
- Page 197 and 198: Bibliography Defossez, P., Richard,
- Page 199 and 200: Bibliography Gregory, A.S.; Whalley
- Page 201 and 202: Bibliography Lamande, M., Schjonnin
- Page 203 and 204: Bibliography Seig, D., 1985. Soil C
- Page 205 and 206: Appendix 11 APPENDIX Ph.D. Thesis D
- Page 207 and 208: Appendix Figure 32: VCL sample at t
- Page 209 and 210: Appendix comparison at the deepest
- Page 211 and 212: Appendix Estimated Pressure (kPa) 2
- Page 213 and 214: Appendix 11.1.1.2.1 SOCOMO One of t
- Page 215 and 216: Appendix by Seig (1985) who showed
- Page 217 and 218: Appendix Soil water content 15 % an
- Page 219 and 220: Appendix Adapting critical state so
- Page 221 and 222: Appendix density is obtained by add
- Page 223 and 224: Appendix Table 5: Values of constan
- Page 225 and 226: Appendix choice of a concentration
- Page 227 and 228: Appendix 11.1.3.1 Dense/Hard and Lo
- Page 229 and 230: Appendix 11.1.3.2 Stratified Soil C
- Page 231 and 232:
Appendix To summarize the ability t
- Page 233 and 234:
Appendix In the following the predi
- Page 235 and 236:
Appendix concentration factor of 4,
- Page 237 and 238:
Appendix 11.1.5.1 Confining Pressur
- Page 239 and 240:
Appendix Figure 24. The VCL created
- Page 241 and 242:
Appendix Rel. Density 2 1,9 1,8 1,7
- Page 243 and 244:
Appendix relation of � 1 to � 2
- Page 245 and 246:
Appendix Rel. Density 2 1,9 1,8 1,7
- Page 247 and 248:
Appendix Rel. Density 1,7 1,68 1,66
- Page 249 and 250:
Appendix Depth (mm) 0,0 100,0 200,0
- Page 251 and 252:
Appendix Figure 42: Plate in cookin
- Page 253 and 254:
Appendix � z � � �� k c p
- Page 255 and 256:
Appendix Table 8: n and k depending
- Page 257 and 258:
Appendix to the plate sinkage equat
- Page 259 and 260:
Appendix with a slight deviation fr
- Page 261:
Appendix Table 12: DBD values for a