- Page 1 and 2:
Cranfield University School of Appl
- Page 3 and 4:
Abstract Ancillary experiments show
- Page 5 and 6:
Table of Contents TABLE OF CONTENTS
- Page 7 and 8:
Table of Contents 4.1.3 Analysis of
- Page 9 and 10:
Table of Contents 11.1.1.1 Comparis
- Page 11 and 12:
List of Figures and Tables Figure 3
- Page 13 and 14:
List of Figures and Tables Figure 1
- Page 15 and 16:
Nomenclature NOMENCLATURE Abbreviat
- Page 17 and 18:
Introduction 1 INTRODUCTION 1.1 Bac
- Page 19 and 20:
Introduction � Ansorge, D. and Go
- Page 21 and 22:
Introduction 1.2 Aim To elucidate t
- Page 23 and 24:
Introduction a) the soil compaction
- Page 25 and 26:
Experimental Methods 2.1.1.1 Test F
- Page 27 and 28: Experimental Methods had been mount
- Page 29 and 30: Experimental Methods track; the loa
- Page 31 and 32: Experimental Methods 800/10.5/2.5 t
- Page 33 and 34: Experimental Methods term. In the m
- Page 35 and 36: Experimental Methods Soil Surface F
- Page 37 and 38: Experimental Methods Depth (cm) 0 1
- Page 39 and 40: Experimental Methods ence surface c
- Page 41 and 42: Experimental Methods chine derives
- Page 43 and 44: Experimental Methods depth. The dat
- Page 45 and 46: Experimental Methods with water and
- Page 47 and 48: Experimental Methods 2.4 Statistica
- Page 49 and 50: Laboratory Studies Into Undercarria
- Page 51 and 52: Laboratory Studies Into Undercarria
- Page 53 and 54: Laboratory Studies Into Undercarria
- Page 55 and 56: Laboratory Studies Into Undercarria
- Page 57 and 58: Laboratory Studies Into Undercarria
- Page 59 and 60: Laboratory Studies Into Undercarria
- Page 61 and 62: Laboratory Studies Into Undercarria
- Page 63 and 64: Laboratory Studies Into Undercarria
- Page 65 and 66: Laboratory Studies Into Undercarria
- Page 67 and 68: Laboratory Studies Into Undercarria
- Page 69 and 70: Laboratory Studies Into Undercarria
- Page 71 and 72: Laboratory Studies Into Undercarria
- Page 73 and 74: Laboratory Studies Into Undercarria
- Page 75 and 76: Laboratory Studies Into Undercarria
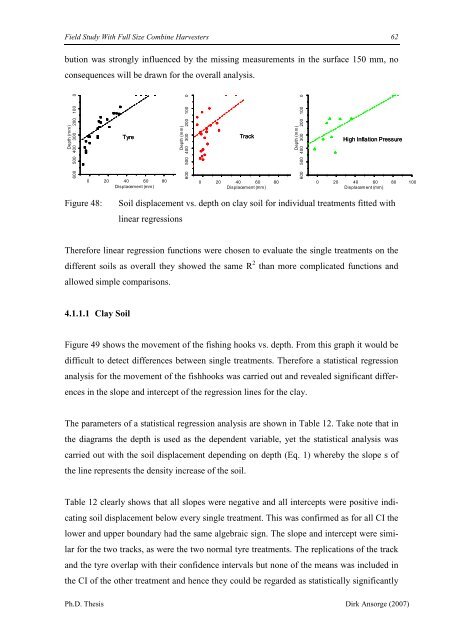
- Page 77: Field Study With Full Size Combine
- Page 81 and 82: Field Study With Full Size Combine
- Page 83 and 84: Field Study With Full Size Combine
- Page 85 and 86: Field Study With Full Size Combine
- Page 87 and 88: Field Study With Full Size Combine
- Page 89 and 90: Field Study With Full Size Combine
- Page 91 and 92: Field Study With Full Size Combine
- Page 93 and 94: Field Study With Full Size Combine
- Page 95 and 96: Field Study With Full Size Combine
- Page 97 and 98: Field Study With Full Size Combine
- Page 99 and 100: Alleviation of Soil Compaction Howe
- Page 101 and 102: Alleviation of Soil Compaction not
- Page 103 and 104: Alleviation of Soil Compaction in a
- Page 105 and 106: Alleviation of Soil Compaction diff
- Page 107 and 108: Soil Compaction Models sibilities t
- Page 109 and 110: Soil Compaction Models depends on t
- Page 111 and 112: Soil Compaction Models Wroth (1968)
- Page 113 and 114: Soil Compaction Models however, the
- Page 115 and 116: Soil Compaction Models level. Criti
- Page 117 and 118: Soil Compaction Models Utilizing Ke
- Page 119 and 120: Soil Compaction Models average of m
- Page 121 and 122: Soil Compaction Models Depth (mm) -
- Page 123 and 124: Soil Compaction Models ture content
- Page 125 and 126: Soil Compaction Models with four ot
- Page 127 and 128: Soil Compaction Models Predicted In
- Page 129 and 130:
Soil Compaction Models Depth (mm) -
- Page 131 and 132:
Soil Compaction Models and 13.7 % b
- Page 133 and 134:
Soil Compaction Models Rel. Density
- Page 135 and 136:
Soil Compaction Models VCL paramete
- Page 137 and 138:
Soil Compaction Models The approach
- Page 139 and 140:
Soil Compaction Models surface stay
- Page 141 and 142:
Soil Compaction Models This result
- Page 143 and 144:
Soil Compaction Models 6.6.1.3 Wate
- Page 145 and 146:
Soil Compaction Models σσ 1 (kPA)
- Page 147 and 148:
Soil Compaction Models pressure to
- Page 149 and 150:
Soil Compaction Models The response
- Page 151 and 152:
Soil Compaction Models On medium so
- Page 153 and 154:
Soil Compaction Models SOILFLEX tak
- Page 155 and 156:
Ancillary Experiments 7 ANCILLARY E
- Page 157 and 158:
Ancillary Experiments Average conta
- Page 159 and 160:
Ancillary Experiments In order to c
- Page 161 and 162:
Ancillary Experiments contrary, the
- Page 163 and 164:
Ancillary Experiments Figure 102: S
- Page 165 and 166:
Ancillary Experiments track and the
- Page 167 and 168:
Ancillary Experiments even when hav
- Page 169 and 170:
Ancillary Experiments 7.3.2 Influen
- Page 171 and 172:
Ancillary Experiments The results f
- Page 173 and 174:
Ancillary Experiments Figure 117: S
- Page 175 and 176:
Ancillary Experiments Contact Press
- Page 177 and 178:
Ancillary Experiments Figure 123: F
- Page 179 and 180:
Ancillary Experiments Sinkage (mm)
- Page 181 and 182:
Ancillary Experiments model which o
- Page 183 and 184:
Ancillary Experiments 7.3.5 The Inf
- Page 185 and 186:
Ancillary Experiments 7.3.7 Discuss
- Page 187 and 188:
Ancillary Experiments Terzaghi (194
- Page 189 and 190:
Ancillary Experiments contact area.
- Page 191 and 192:
Ancillary Experiments soil forward
- Page 193 and 194:
Conclusions � The longitudinal so
- Page 195 and 196:
Bibliography 10 BIBLIOGRAPHY Aboaba
- Page 197 and 198:
Bibliography Defossez, P., Richard,
- Page 199 and 200:
Bibliography Gregory, A.S.; Whalley
- Page 201 and 202:
Bibliography Lamande, M., Schjonnin
- Page 203 and 204:
Bibliography Seig, D., 1985. Soil C
- Page 205 and 206:
Appendix 11 APPENDIX Ph.D. Thesis D
- Page 207 and 208:
Appendix Figure 32: VCL sample at t
- Page 209 and 210:
Appendix comparison at the deepest
- Page 211 and 212:
Appendix Estimated Pressure (kPa) 2
- Page 213 and 214:
Appendix 11.1.1.2.1 SOCOMO One of t
- Page 215 and 216:
Appendix by Seig (1985) who showed
- Page 217 and 218:
Appendix Soil water content 15 % an
- Page 219 and 220:
Appendix Adapting critical state so
- Page 221 and 222:
Appendix density is obtained by add
- Page 223 and 224:
Appendix Table 5: Values of constan
- Page 225 and 226:
Appendix choice of a concentration
- Page 227 and 228:
Appendix 11.1.3.1 Dense/Hard and Lo
- Page 229 and 230:
Appendix 11.1.3.2 Stratified Soil C
- Page 231 and 232:
Appendix To summarize the ability t
- Page 233 and 234:
Appendix In the following the predi
- Page 235 and 236:
Appendix concentration factor of 4,
- Page 237 and 238:
Appendix 11.1.5.1 Confining Pressur
- Page 239 and 240:
Appendix Figure 24. The VCL created
- Page 241 and 242:
Appendix Rel. Density 2 1,9 1,8 1,7
- Page 243 and 244:
Appendix relation of � 1 to � 2
- Page 245 and 246:
Appendix Rel. Density 2 1,9 1,8 1,7
- Page 247 and 248:
Appendix Rel. Density 1,7 1,68 1,66
- Page 249 and 250:
Appendix Depth (mm) 0,0 100,0 200,0
- Page 251 and 252:
Appendix Figure 42: Plate in cookin
- Page 253 and 254:
Appendix � z � � �� k c p
- Page 255 and 256:
Appendix Table 8: n and k depending
- Page 257 and 258:
Appendix to the plate sinkage equat
- Page 259 and 260:
Appendix with a slight deviation fr
- Page 261:
Appendix Table 12: DBD values for a