- Page 1 and 2:
Saurashtra University Re - Accredit
- Page 3 and 4:
Ecology of brown bear (Ursus arctos
- Page 5 and 6:
Contents Acknowledgements i-iv Summ
- Page 7 and 8:
List of Tables Chapter 4: Feeding e
- Page 9 and 10:
Figure 5. Presence of food items in
- Page 11 and 12:
Photograph 11. Collection of brown
- Page 13 and 14:
ACKNOWLEDGEMENTS Several individual
- Page 15 and 16:
logistic support in the alpine and
- Page 17 and 18:
Summary The brown bear is widely di
- Page 19 and 20:
own bears and seasonal difference i
- Page 21 and 22:
use of these habitat categories. Si
- Page 23 and 24:
Chapter 1 1.1 Bear species and dist
- Page 25 and 26:
Hokkaido, the Hokkaido brown bear (
- Page 27 and 28:
1.2 Status of bear species All bear
- Page 29 and 30:
human beings. The resources availab
- Page 31 and 32:
protection methods have been studie
- Page 33 and 34:
viii. The study will also help sugg
- Page 35 and 36:
Brown bears were found tetrapedal,
- Page 37 and 38:
hence created their own dens. Brown
- Page 39 and 40:
2.5 Habitat use pattern Johnson (19
- Page 41 and 42:
evealed that although both preferre
- Page 43 and 44:
Marchinton, 1980; Smith, 1986; Hell
- Page 45 and 46:
and ground nesting birds and their
- Page 47 and 48:
kelp, mollusks, fish and remains of
- Page 49 and 50:
during early summer (Hamer and Herr
- Page 51 and 52: 1983a). Although insects constitute
- Page 53 and 54: fruits and mammals. Their study als
- Page 55 and 56: geographically (LeFranc et al., 198
- Page 57 and 58: commodities in their search for alt
- Page 59 and 60: Yellowstone National Park between 1
- Page 61 and 62: ear-livestock interactions were rep
- Page 63 and 64: Gamgul Siabehi are relatively less
- Page 65 and 66: A list of angiosperms and gymnosper
- Page 67 and 68: (Ursus arctos), the other wild anim
- Page 69 and 70: Chapter 4 Feeding ecology of brown
- Page 71 and 72: 1984; Mace and Jonkel, 1986; Odhach
- Page 73 and 74: these scats were separately placed
- Page 75 and 76: were analysed, and the proportion o
- Page 77 and 78: Fragaria nubicola 34 times. Photogr
- Page 79 and 80: Figure 5 showed marked monthly vari
- Page 81 and 82: the method of percent occurrence of
- Page 83 and 84: (Hedysarum alpinum) roots and main
- Page 85 and 86: and Aoi, 1987). The higher occurren
- Page 87 and 88: constituted a major portion of earl
- Page 89 and 90: Figure 2. Frequency occurrence of a
- Page 91 and 92: Continued Food items Occurrence Sum
- Page 93 and 94: Figure 4. Number of direct feeding
- Page 95 and 96: Table 3. Availability of food items
- Page 97 and 98: Table 2. Number of direct feeding o
- Page 99 and 100: omnivorous generalist lifestyle. Br
- Page 101: systematic information is available
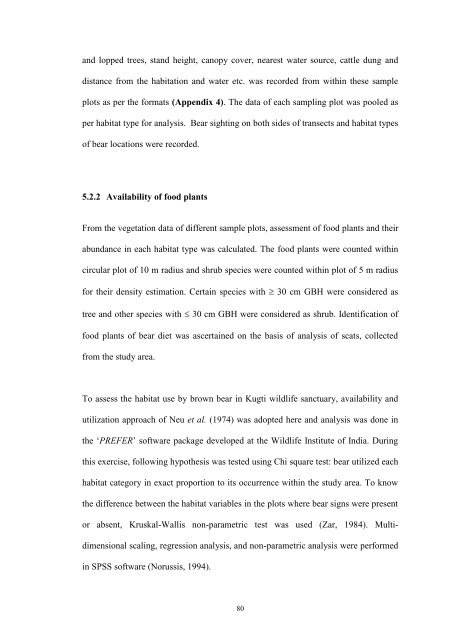
- Page 105 and 106: for Agricultural land category and
- Page 107 and 108: 5.3.3 Habitat availability vs. util
- Page 109 and 110: ocks with slope grasses (38.4%), Mi
- Page 111 and 112: gentle slope terrain was found to b
- Page 113 and 114: Exposed rock with slope grasses and
- Page 115 and 116: found mainly dependent on availabil
- Page 117 and 118: availability of brown bear habitat
- Page 119 and 120: Ballard et al., 1993) and interior
- Page 121 and 122: slope terrain was found to be highe
- Page 123 and 124: Table 1. Continued S. No. Dry alpin
- Page 125 and 126: Table 3. Frequency of occurrence of
- Page 127 and 128: Table 5. Seasonal variation in habi
- Page 129 and 130: Table 7. Proportional availability
- Page 131 and 132: Figure 1: Sampling layout for veget
- Page 133 and 134: livestock and attack on people. In
- Page 135 and 136: 1978; Knight and Judd, 1983; Garshe
- Page 137 and 138: develop mitigation strategies that
- Page 139 and 140: division, Chamba wildlife division,
- Page 141 and 142: in the sanctuary area. Figure 1 als
- Page 143 and 144: Different plant species, phenologic
- Page 145 and 146: Damage to wheat crop was 15-25%. Ma
- Page 147 and 148: Ghiula dhar, Bharali Kinnaur dhar,
- Page 149 and 150: Livestock depredation by brown bear
- Page 151 and 152: The studies conducted in India and
- Page 153 and 154:
Table 1. List of grazing pastures o
- Page 155 and 156:
Table 3. Livestock depredation in d
- Page 157 and 158:
Figure 1. Livestock depredation in
- Page 159:
Table 5. Agricultural crops and the
- Page 162 and 163:
Table 7. Damage to agricultural cro
- Page 164 and 165:
7. Suggestions and recommendations
- Page 166 and 167:
4. In Kugti wildlife sanctuary, the
- Page 168 and 169:
During evening and night time, the
- Page 170 and 171:
17. Brown bears cause extensive dam
- Page 172 and 173:
References Abe, H., Aoi, T., Tsubot
- Page 174 and 175:
Aune, K. and Kasworm, W. (1989). Fi
- Page 176 and 177:
Berns, V.D., Atwell, G.C. and Boone
- Page 178 and 179:
Chauhan, N.P.S. (2003). Human casua
- Page 180 and 181:
Craighead, F.C., Jr. and Craighead,
- Page 182 and 183:
Elgmork, K. and Kassa, J. (1992). F
- Page 184 and 185:
Garcia-Gaona, J.F. (1997). Damages
- Page 186 and 187:
Gunther, K.A. and Renkin, R.A. (199
- Page 188 and 189:
Herrero, S. (1978). A comparison of
- Page 190 and 191:
Irving, L. and Krog, J. (1954). Bod
- Page 192 and 193:
Joshi, A.R., Garshelis, D.L. and Sm
- Page 194 and 195:
Krishna Raju, K.S.R., Krishna Murth
- Page 196 and 197:
Mace, R.D. and Waller, J.S. (1996).
- Page 198 and 199:
Mattson, D.J. and Hovey, F.W. (1995
- Page 200 and 201:
Mertzanis, G. (1994). Brown bear in
- Page 202 and 203:
Nawaz, M.A. (2007). Status of the b
- Page 204 and 205:
Pazhetnov, V.S. (1990). Brown bear.
- Page 206 and 207:
Reynolds, D.G. and Beecham, J. (198
- Page 208 and 209:
Sathyakumar, S. (2006a). The status
- Page 210 and 211:
Sellers, R.D. and Aumiller, L.D. (1
- Page 212 and 213:
Stein, J.T. (2000). From exterminat
- Page 214 and 215:
Van Daele, L.J. (1995). Unit 17 bro
- Page 216 and 217:
Yamanaka, M., Yasue, K. and Ohtaish
- Page 218 and 219:
Continued S. No. Common name Genus
- Page 220 and 221:
Continued S. No. Common name Genus
- Page 222 and 223:
Continued S. No. Common name Genus
- Page 224 and 225:
Appendix 3. GPS location of line tr
- Page 226 and 227:
Appendix 4 Format - 1(a) Vegetation
- Page 228 and 229:
Format - 1(c) Vegetation Compositio
- Page 230 and 231:
Format - 1(f) Biotic Pressures Tran
- Page 232 and 233:
Format - 2(b) Distribution and Abun
- Page 234 and 235:
4. Occupational Pattern: i. Noumber
- Page 236 and 237:
vii. Crop damage month-wise: Tick m
- Page 238 and 239:
E. NTFP collection: Name Species Qu


