

Contents Telektronikk - Telenor
Contents Telektronikk - Telenor
Contents Telektronikk - Telenor

You also want an ePaper? Increase the reach of your titles
YUMPU automatically turns print PDFs into web optimized ePapers that Google loves.
BPS<br />
800.000<br />
8<br />
700.000<br />
600.000<br />
500.000<br />
400.000<br />
300.000<br />
200.000<br />
100.000<br />
0<br />
BPS<br />
400.000<br />
300.000<br />
200.000<br />
100.000<br />
11 12 13 14<br />
a<br />
Hours<br />
0<br />
BPS<br />
160.000<br />
140.000<br />
120.000<br />
100.000<br />
80.000<br />
60.000<br />
40.000<br />
20.000<br />
11 12 13 14<br />
Hours<br />
b<br />
0<br />
11 12 13 14<br />
Hours<br />
c<br />
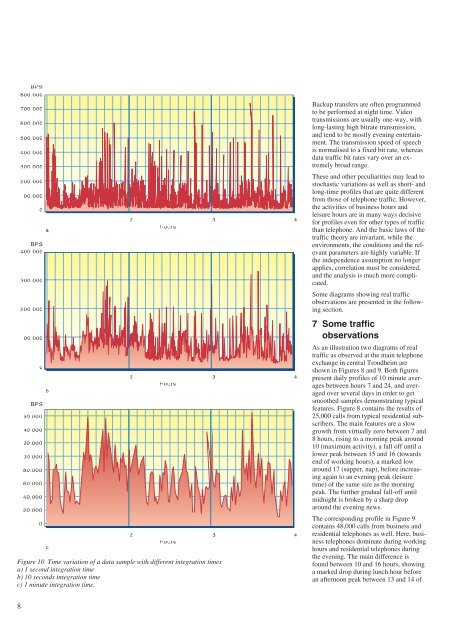
Figure 10 Time variation of a data sample with different integration times<br />
a) 1 second integration time<br />
b) 10 seconds integration time<br />
c) 1 minute integration time.<br />
Backup transfers are often programmed<br />
to be performed at night time. Video<br />
transmissions are usually one-way, with<br />
long-lasting high bitrate transmission,<br />
and tend to be mostly evening entertainment.<br />
The transmission speed of speech<br />
is normalised to a fixed bit rate, whereas<br />
data traffic bit rates vary over an extremely<br />
broad range.<br />
These and other peculiarities may lead to<br />
stochastic variations as well as short- and<br />
long-time profiles that are quite different<br />
from those of telephone traffic. However,<br />
the activities of business hours and<br />
leisure hours are in many ways decisive<br />
for profiles even for other types of traffic<br />
than telephone. And the basic laws of the<br />
traffic theory are invariant, while the<br />
environments, the conditions and the relevant<br />
parameters are highly variable. If<br />
the independence assumption no longer<br />
applies, correlation must be considered,<br />
and the analysis is much more complicated.<br />
Some diagrams showing real traffic<br />
observations are presented in the following<br />
section.<br />
7 Some traffic<br />
observations<br />
As an illustration two diagrams of real<br />
traffic as observed at the main telephone<br />
exchange in central Trondheim are<br />
shown in Figures 8 and 9. Both figures<br />
present daily profiles of 10 minute averages<br />
between hours 7 and 24, and averaged<br />
over several days in order to get<br />
smoothed samples demonstrating typical<br />
features. Figure 8 contains the results of<br />
25,000 calls from typical residential subscribers.<br />
The main features are a slow<br />
growth from virtually zero between 7 and<br />
8 hours, rising to a morning peak around<br />
10 (maximum activity), a fall off until a<br />
lower peak between 15 and 16 (towards<br />
end of working hours), a marked low<br />
around 17 (supper, nap), before increasing<br />
again to an evening peak (leisure<br />
time) of the same size as the morning<br />
peak. The further gradual fall-off until<br />
midnight is broken by a sharp drop<br />
around the evening news.<br />
The corresponding profile in Figure 9<br />
contains 48,000 calls from business and<br />
residential telephones as well. Here, business<br />
telephones dominate during working<br />
hours and residential telephones during<br />
the evening. The main difference is<br />
found between 10 and 16 hours, showing<br />
a marked drop during lunch hour before<br />
an afternoon peak between 13 and 14 of


