

Contents Telektronikk - Telenor
Contents Telektronikk - Telenor
Contents Telektronikk - Telenor

You also want an ePaper? Increase the reach of your titles
YUMPU automatically turns print PDFs into web optimized ePapers that Google loves.
110<br />
radio<br />
interface<br />
tion inside a building. In the second view<br />
a street situation is studied. Most likely<br />
the first view would consider a smaller<br />
area compared to the street situation.<br />
Therefore, more details may be included.<br />
In the same way we want the model to<br />
adapt to the scale. For instance, we could<br />
choose to regard some phenomena in<br />
more detail while others could be lumped<br />
together or considered as outside the<br />
modelled part. In this way base stations<br />
covering small areas could, for instance,<br />
be considered to be outside the model.<br />
Then, any handover calls from these base<br />
stations to the base stations included in<br />
the model could be regarded as new calls<br />
with a modified call duration. Several<br />
classes of mobile stations could also be<br />
regarded as one class while studying a<br />
particular class in more detail. Figure 7<br />
shows some examples. In the first view<br />
we have chosen to consider the outside<br />
base stations as interference sources,<br />
another solution is to include them as<br />
secondary servers, i.e. they would handle<br />
any overflow traffic for some services. In<br />
view 2 the base stations inside the building<br />
are not taken into account explicitly.<br />
In the more general case, a part of the<br />
area could be modelled with a greater<br />
detail while other parts are represented in<br />
a more coarse way. In addition, we could<br />
use more coarse models in order to get<br />
some overall results quickly.<br />
The requested output data or results we<br />
want to get from such a model are also<br />
included in the requirements to the<br />
base<br />
stations<br />
control<br />
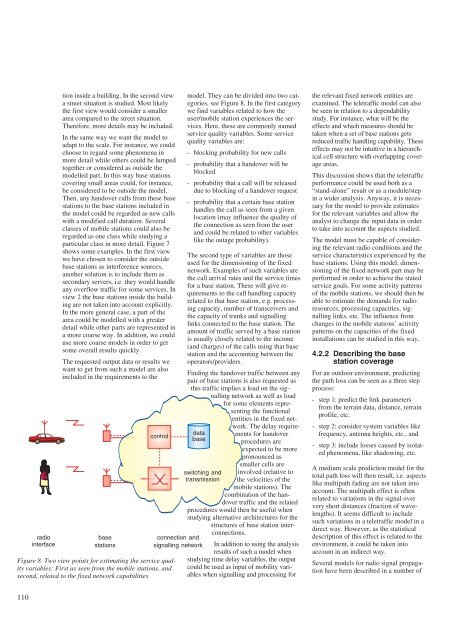
Figure 8 Two view points for estimating the service quality<br />
variables: First as seen from the mobile stations, and<br />
second, related to the fixed network capabilities<br />
model. They can be divided into two categories,<br />
see Figure 8. In the first category<br />
we find variables related to how the<br />
user/mobile station experiences the services.<br />
Here, these are commonly named<br />
service quality variables. Some service<br />
quality variables are:<br />
- blocking probability for new calls<br />
- probability that a handover will be<br />
blocked<br />
- probability that a call will be released<br />
due to blocking of a handover request<br />
- probability that a certain base station<br />
handles the call as seen from a given<br />
location (may influence the quality of<br />
the connection as seen from the user<br />
and could be related to other variables<br />
like the outage probability).<br />
The second type of variables are those<br />
used for the dimensioning of the fixed<br />
network. Examples of such variables are<br />
the call arrival rates and the service times<br />
for a base station. These will give requirements<br />
to the call handling capacity<br />
related to that base station, e.g. processing<br />
capacity, number of transceivers and<br />
the capacity of trunks and signalling<br />
links connected to the base station. The<br />
amount of traffic served by a base station<br />
is usually closely related to the income<br />
(and charges) of the calls using that base<br />
station and the accounting between the<br />
operators/providers.<br />
Finding the handover traffic between any<br />
pair of base stations is also requested as<br />
this traffic implies a load on the signalling<br />
network as well as load<br />
for some elements representing<br />
the functional<br />
entities in the fixed net-<br />
data<br />
base<br />
switching and<br />
transmission<br />
connection and<br />
signalling network<br />
work. The delay requirements<br />
for handover<br />
procedures are<br />
expected to be more<br />
pronounced as<br />
smaller cells are<br />
involved (relative to<br />
the velocities of the<br />
mobile stations). The<br />
combination of the handover<br />
traffic and the related<br />
procedures would then be useful when<br />
studying alternative architectures for the<br />
structures of base station inter-<br />
connections.<br />
In addition to using the analysis<br />
results of such a model when<br />
studying time delay variables, the output<br />
could be used as input of mobility variables<br />
when signalling and processing for<br />
the relevant fixed network entities are<br />
examined. The teletraffic model can also<br />
be seen in relation to a dependability<br />
study. For instance, what will be the<br />
effects and which measures should be<br />
taken when a set of base stations gets<br />
reduced traffic handling capability. These<br />
effects may not be intuitive in a hierarchical<br />
cell structure with overlapping coverage<br />
areas.<br />
This discussion shows that the teletraffic<br />
performance could be used both as a<br />
“stand-alone” result or as a module/step<br />
in a wider analysis. Anyway, it is necessary<br />
for the model to provide estimates<br />
for the relevant variables and allow the<br />
analyst to change the input data in order<br />
to take into account the aspects studied.<br />
The model must be capable of considering<br />
the relevant radio conditions and the<br />
service characteristics experienced by the<br />
base stations. Using this model, dimensioning<br />
of the fixed network part may be<br />
performed in order to achieve the stated<br />
service goals. For some activity patterns<br />
of the mobile stations, we should then be<br />
able to estimate the demands for radio<br />
resources, processing capacities, signalling<br />
links, etc. The influence from<br />
changes in the mobile stations’ activity<br />
patterns on the capacities of the fixed<br />
installations can be studied in this way.<br />
4.2.2 Describing the base<br />
station coverage<br />
For an outdoor environment, predicting<br />
the path loss can be seen as a three step<br />
process:<br />
- step 1: predict the link parameters<br />
from the terrain data, distance, terrain<br />
profile, etc.<br />
- step 2: consider system variables like<br />
frequency, antenna heights, etc., and<br />
- step 3: include losses caused by isolated<br />
phenomena, like shadowing, etc.<br />
A medium scale prediction model for the<br />
total path loss will then result, i.e. aspects<br />
like multipath fading are not taken into<br />
account. The multipath effect is often<br />
related to variations in the signal over<br />
very short distances (fraction of wavelengths).<br />
It seems difficult to include<br />
such variations in a teletraffic model in a<br />
direct way. However, as the statistical<br />
description of this effect is related to the<br />
environment, it could be taken into<br />
account in an indirect way.<br />
Several models for radio signal propagation<br />
have been described in a number of


