

Contents Telektronikk - Telenor
Contents Telektronikk - Telenor
Contents Telektronikk - Telenor

You also want an ePaper? Increase the reach of your titles
YUMPU automatically turns print PDFs into web optimized ePapers that Google loves.
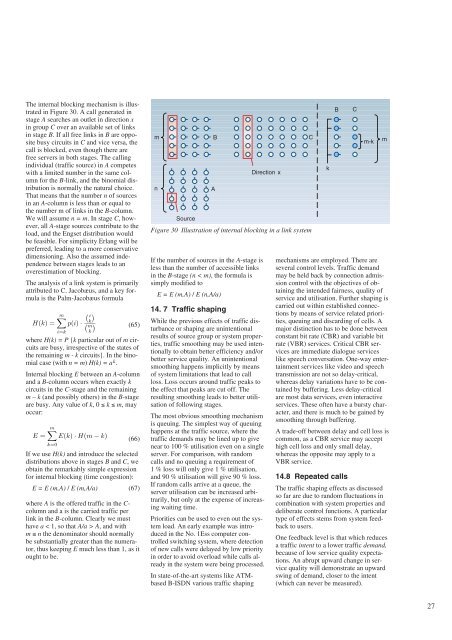
The internal blocking mechanism is illustrated<br />
in Figure 30. A call generated in<br />
stage A searches an outlet in direction x<br />
in group C over an available set of links<br />
in stage B. If all free links in B are opposite<br />
busy circuits in C and vice versa, the<br />
call is blocked, even though there are<br />
free servers in both stages. The calling<br />
individual (traffic source) in A competes<br />
with a limited number in the same column<br />
for the B-link, and the binomial distribution<br />
is normally the natural choice.<br />
That means that the number n of sources<br />
in an A-column is less than or equal to<br />
the number m of links in the B-column.<br />
We will assume n = m. In stage C, however,<br />
all A-stage sources contribute to the<br />
load, and the Engset distribution would<br />
be feasible. For simplicity Erlang will be<br />
preferred, leading to a more conservative<br />
dimensioning. Also the assumed independence<br />
between stages leads to an<br />
overestimation of blocking.<br />
The analysis of a link system is primarily<br />
attributed to C. Jacobæus, and a key formula<br />
is the Palm-Jacobæus formula<br />
H(k) =<br />
(65)<br />
where H(k) = P {k particular out of m circuits<br />
are busy, irrespective of the states of<br />
the remaining m - k circuits}. In the binomial<br />
case (with n = m) H(k) = ak .<br />
Internal blocking E between an A-column<br />
and a B-column occurs when exactly k<br />
circuits in the C-stage and the remaining<br />
m – k (and possibly others) in the B-stage<br />
are busy. Any value of k, 0 ≤ k ≤ m, may<br />
occur:<br />
E =<br />
m�<br />
p(i) ·<br />
i=k<br />
�i � k<br />
m<br />
k<br />
�<br />
�<br />
m�<br />
E(k) · H(m − k)<br />
k=0<br />
(66)<br />
If we use H(k) and introduce the selected<br />
distributions above in stages B and C, we<br />
obtain the remarkably simple expression<br />
for internal blocking (time congestion):<br />
E = E (m,A) / E (m,A/a) (67)<br />
where A is the offered traffic in the Ccolumn<br />
and a is the carried traffic per<br />
link in the B-column. Clearly we must<br />
have a < 1, so that A/a > A, and with<br />
m ≤ n the denominator should normally<br />
be substantially greater than the numerator,<br />
thus keeping E much less than 1, as it<br />
ought to be.<br />
m<br />
n<br />
Source<br />
If the number of sources in the A-stage is<br />
less than the number of accessible links<br />
in the B-stage (n < m), the formula is<br />
simply modified to<br />
E = E (m,A) / E (n,A/a)<br />
14. 7 Traffic shaping<br />
B C<br />
While the previous effects of traffic disturbance<br />
or shaping are unintentional<br />
results of source group or system properties,<br />
traffic smoothing may be used intentionally<br />
to obtain better efficiency and/or<br />
better service quality. An unintentional<br />
smoothing happens implicitly by means<br />
of system limitations that lead to call<br />
loss. Loss occurs around traffic peaks to<br />
the effect that peaks are cut off. The<br />
resulting smoothing leads to better utilisation<br />
of following stages.<br />
The most obvious smoothing mechanism<br />
is queuing. The simplest way of queuing<br />
happens at the traffic source, where the<br />
traffic demands may be lined up to give<br />
near to 100 % utilisation even on a single<br />
server. For comparison, with random<br />
calls and no queuing a requirement of<br />
1 % loss will only give 1 % utilisation,<br />
and 90 % utilisation will give 90 % loss.<br />
If random calls arrive at a queue, the<br />
server utilisation can be increased arbitrarily,<br />
but only at the expense of increasing<br />
waiting time.<br />
Priorities can be used to even out the system<br />
load. An early example was introduced<br />
in the No. 1Ess computer controlled<br />
switching system, where detection<br />
of new calls were delayed by low priority<br />
in order to avoid overload while calls already<br />
in the system were being processed.<br />
In state-of-the-art systems like ATMbased<br />
B-ISDN various traffic shaping<br />
A<br />
Direction x<br />
Figure 30 Illustration of internal blocking in a link system<br />
k<br />
B C<br />
m-k m<br />
mechanisms are employed. There are<br />
several control levels. Traffic demand<br />
may be held back by connection admission<br />
control with the objectives of obtaining<br />
the intended fairness, quality of<br />
service and utilisation. Further shaping is<br />
carried out within established connections<br />
by means of service related priorities,<br />
queuing and discarding of cells. A<br />
major distinction has to be done between<br />
constant bit rate (CBR) and variable bit<br />
rate (VBR) services. Critical CBR services<br />
are immediate dialogue services<br />
like speech conversation. One-way entertainment<br />
services like video and speech<br />
transmission are not so delay-critical,<br />
whereas delay variations have to be contained<br />
by buffering. Less delay-critical<br />
are most data services, even interactive<br />
services. These often have a bursty character,<br />
and there is much to be gained by<br />
smoothing through buffering.<br />
A trade-off between delay and cell loss is<br />
common, as a CBR service may accept<br />
high cell loss and only small delay,<br />
whereas the opposite may apply to a<br />
VBR service.<br />
14.8 Repeated calls<br />
The traffic shaping effects as discussed<br />
so far are due to random fluctuations in<br />
combination with system properties and<br />
deliberate control functions. A particular<br />
type of effects stems from system feedback<br />
to users.<br />
One feedback level is that which reduces<br />
a traffic intent to a lower traffic demand,<br />
because of low service quality expectations.<br />
An abrupt upward change in service<br />
quality will demonstrate an upward<br />
swing of demand, closer to the intent<br />
(which can never be measured).<br />
27


