Download the 2009 annual report in PDF format - ANF
Download the 2009 annual report in PDF format - ANF
Download the 2009 annual report in PDF format - ANF

You also want an ePaper? Increase the reach of your titles
YUMPU automatically turns print PDFs into web optimized ePapers that Google loves.
86<br />
INFORMATION ABOUT <strong>ANF</strong><br />
Reports and <strong>in</strong><strong>format</strong>ion for <strong>the</strong> Shareholders’ Meet<strong>in</strong>g<br />
6. Reports and <strong>in</strong><strong>format</strong>ion<br />
for <strong>the</strong> Shareholders’ Meet<strong>in</strong>g<br />
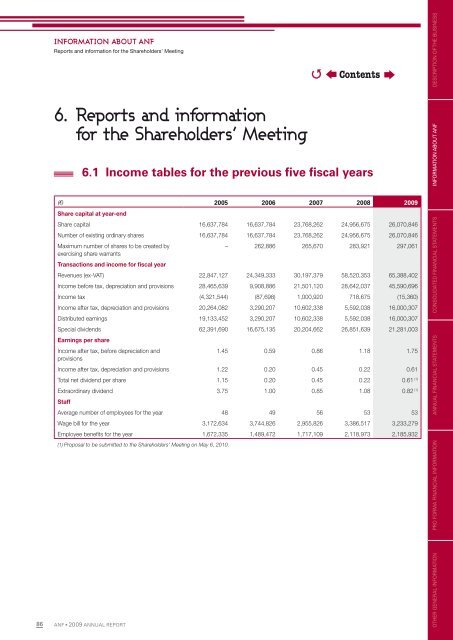
6.1 Income tables for <strong>the</strong> previous fi ve fi scal years<br />
(€) 2005 2006 2007 2008 <strong>2009</strong><br />
Share capital at year-end<br />
Share capital 16,637,784 16,637,784 23,768,262 24,956,675 26,070,846<br />
Number of exist<strong>in</strong>g ord<strong>in</strong>ary shares 16,637,784 16,637,784 23,768,262 24,956,675 26,070,846<br />
Maximum number of shares to be created by<br />
exercis<strong>in</strong>g share warrants<br />
– 262,886 265,670 283,921 297,061<br />
Transactions and <strong>in</strong>come for fi scal year<br />
Revenues (ex-VAT) 22,847,127 24,349,333 30,197,379 58,520,353 65,388,402<br />
Income before tax, depreciation and provisions 28,465,639 9,908,886 21,501,120 28,642,037 45,590,696<br />
Income tax (4,321,544) (87,698) 1,000,920 718,675 (15,360)<br />
Income after tax, depreciation and provisions 20,264,082 3,290,207 10,602,338 5,592,038 16,000,307<br />
Distributed earn<strong>in</strong>gs 19,133,452 3,290,207 10,602,338 5,592,038 16,000,307<br />
Special dividends 62,391,690 16,675,135 20,204,662 26,851,639 21,281,003<br />
Earn<strong>in</strong>gs per share<br />
Income after tax, before depreciation and<br />
provisions<br />
<strong>ANF</strong> • <strong>2009</strong> ANNUAL REPORT<br />
1.45 0.59 0.86 1.18 1.75<br />
Income after tax, depreciation and provisions 1.22 0.20 0.45 0.22 0.61<br />
Total net dividend per share 1.15 0.20 0.45 0.22 0.61 (1)<br />
Extraord<strong>in</strong>ary dividend 3.75 1.00 0.85 1.08 0.82 (1)<br />
Staff<br />
Average number of employees for <strong>the</strong> year 48 49 56 53 53<br />
Wage bill for <strong>the</strong> year 3,172,634 3,744,826 2,955,826 3,386,517 3,233,279<br />
Employee benefi ts for <strong>the</strong> year 1,672,335 1,489,472 1,717,109 2,118,973 2,185,932<br />
(1) Proposal to be submitted to <strong>the</strong> Shareholders’ Meet<strong>in</strong>g on May 6, 2010.<br />
�<br />
Contents<br />
OTHER GENERAL INFORMATION PRO FORMA FINANCIAL INFORMATION ANNUAL FINANCIAL STATEMENTS CONSOLIDATED FINANCIAL STATEMENTS INFORMATION ABOUT <strong>ANF</strong> DESCRIPTION OF THE BUSINESS