Grand Rapids, MichiganLansing, MichiganContact<strong>NAI</strong> West Michigan+1 616 776 0100Metropolitan AreaEconomic Overview2009Population2014 EstimatedPopulationEmploymentPopulationHouseholdAverage Income784,632803,240478,570$64,503The region is in an era of transition as it evolves away fromits traditional reliance on the furniture and auto relatedindustries. While most segments in West Michigan experiencedbelow-average growth, if any, the emerging lifescience industry continued to propel transactions through2009. In general, vacancy was up and rent was down.The office sector reflected the ups and downs of an overalltough year. Activity levels improved late in the year astenants were in the market checking available deals andincentives being offered. Tenants are renegotiating ratesand terms rather than dealing with disruption and costof moving. The medical sector continues to grow as theMichigan State medical school and the Van Andel Institute,Phase II, will be completed in <strong>2010</strong>, and Grand Rapidsbecomes a regional medical care provider.Demand for industrial property in 2009 has been soft. Manycompanies, unsure of their futures, had difficulty makinglong term real estate decisions. In <strong>2010</strong> we expect to seelittle new development. Rather, existing buildings will beredeveloped and used for growing industries in West Michigansuch as medical, wind and solar energy, componentmanufacturing, food processing and related businesses.The retail sector has also seen increased vacancy and loweraverage rents over the past year. With weak leasing activity,landlords are being forced to be more flexible in negotiations.With tightened financial markets, landlords also had difficultyobtaining financing for tenant improvements. Neighborhoodretail centers experienced declines in rental rates andtenants are finding a challenging business environment.Although many restaurants have been cautious aboutexpansion, the West Michigan market has seen some activityin 2009 by national restaurants such as Sonic, Culvers andGolden Corral.Despite the downturn there is some great news in WestMichigan, which includes the Farmer’s Insurance announcementof 1,600 added jobs and 275,000 SF of new officeconstruction. Many tenants are renegotiating reduced rentsin exchange for extended leases.Contact<strong>NAI</strong> Mid-MichiganVlahakis <strong>Commercial</strong>+1 517 487 9222Metropolitan AreaEconomic Overview2009Population2014 EstimatedPopulationEmploymentPopulationHouseholdAverage Income460,491469,554265,711$60,427The Lansing area and tri-area is composed of Ingham, Eatonand Clinton Counties. Lansing's population remains steadyat approximately 450,000. In 2009 the market nearlygrinded to a halt but turned around with signs of life in thefourth quarter. As the debt market corrects itself in 2009, weanticipate the number of transactions to increase into <strong>2010</strong>.The economic trend continued with below average growthin all segments of the market. Lansing's office market hasapproximately 10 million SF with the largest concentrationsin the CBD and East Lansing. The market had steadilyincreasing vacancy rates nearing 25% while the US vacancyrate averaged 15%. As vacancy rates increased in the market,rental rates continued to drop and landlords were forced tooffer significant incentives to attract tenants. The forecastis that pricing should remain relatively flat or decliningmainly due to the uncertainty of the market.The industrial market has shown significant declines inusers and user interest. The market’s largest owner usersare General Motors and Meijer. Both companies have adirect impact on the industrial market, occupying more than20% of the total available space. The largest concentrationof industrial space can be found in West Lansing (EatonCounty), which comprises nearly 50% of the gross leasableproduct in the market. General Motors and suppliers collectivelyhave brought approximately 2 million SF of Class AIndustrial space to the market. This has shuffled the deck inthe industrial market, which consisted of older obsoletebuildings. Vacancies have increased over the past two yearsincreasing from 18% in 2008 to near 25% in 2009. Theoutlook is fair but we expect absorption to be slow.The retail market consists of nearly 14 million SF, primarilylocated in regional malls and strip centers. Factors thatcontributed to growth in previous years were related toactivity from drugstores and bank branch expansion. We canexpect steady economic trends for <strong>2010</strong>.MedianHousehold Income$56,923MedianHousehold Income$56,523Total PopulationMedian Age35Total PopulationMedian Age35West Michigan At A Glance(Rent/SF/YR) Low High Effective Avg. VacancyDOWNTOWN OFFICENew Construction (AAA)Class A (Prime)Class B (Secondary)SUBURBAN OFFICENew Construction (AAA)Class A (Prime)Class B (Secondary)INDUSTRIALBulk WarehouseManufacturingHigh Tech/R&DRETAILDowntownNeighborhood Service CentersCommunity Power CenterRegional Malls$$$$$$$$$$$$$15.0014.005.0012.0010.005.002.002.003.007.507.009.0014.00$$$$$$$$$$$$$25.0024.0012.0018.5017.0011.003.503.506.0020.0020.0023.0035.00$$$$$$$$$$$$$20.0019.008.5015.2513.508.002.752.754.5013.7513.5016.0025.0020.0%20.0%25.0%25.0%20.0%20.0%12.0%12.0%12.0%N/A15.0%4.0%2.0%DEVELOPMENT LAND Low/Acre High/AcreOffice in CBD$ 1,100,000.00 $ 5,000,000.00Land in Office ParksLand in Industrial ParksOffice/Industrial Land - Non-parkRetail/<strong>Commercial</strong> LandResidential$$$$$100,000.0050,000.0030,000.00100,000.005,000.00$$$$$180,000.00125,000.00130,000.00400,000.0030,000.00Lansing At A Glance(Rent/SF/YR) Low High Effective Avg. VacancyDOWNTOWN OFFICENew Construction (AAA)Class A (Prime)Class B (Secondary)SUBURBAN OFFICENew Construction (AAA)Class A (Prime)Class B (Secondary)INDUSTRIALBulk WarehouseManufacturingHigh Tech/R&DRETAILDowntownNeighborhood Service CentersCommunity Power CenterRegional Malls$$$$$$$$$$$$$17.0012.008.0016.0012.006.002.503.004.258.006.5012.0025.00$$$$$$$$$$$$$22.0016.0012.0022.0016.0010.003.504.506.5012.0012.5014.0034.00$$$$$$$$$$$$$19.5014.0010.0018.0014.008.003.003.505.5010.008.7512.5028.0010.0%21.0%30.0%16.0%18.0%28.0%20.0%16.0%15.0%12.0%14.0%12.0%10.0%DEVELOPMENT LAND Low/Acre High/AcreOffice in CBD)Land in Office ParksLand in Industrial Parks)Office/Industrial Land - Non-parkRetail/<strong>Commercial</strong> LandResidential$$$$$$100,000.0080,000.0020,000.0025,000.00200,000.002,500.00$$$$$$400,000.00120,000.0080,000.0050,000.00400,000.00150,000.00<strong>2010</strong> <strong>Global</strong> <strong>Market</strong> <strong>Report</strong> ■ www.naiglobal.com 99
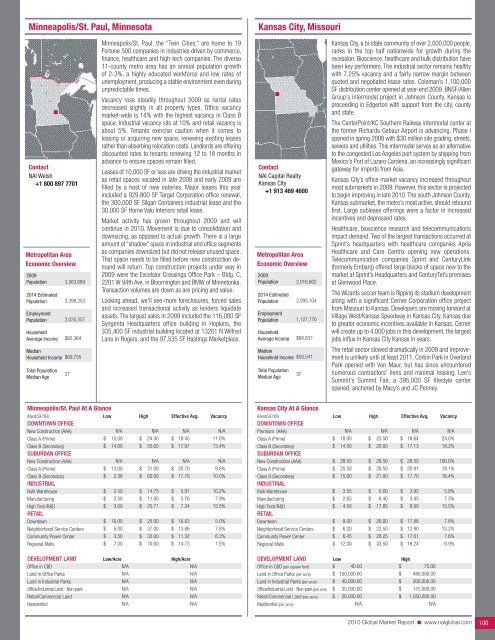
Minneapolis/St. Paul, MinnesotaKansas City, MissouriContact<strong>NAI</strong> Welsh+1 800 897 7701Metropolitan AreaEconomic Overview2009Population2014 EstimatedPopulationEmploymentPopulationHouseholdAverage IncomeMedianHousehold IncomeTotal PopulationMedian Age3,263,6893,398,2532,035,357$82,364$69,75537Minneapolis/St. Paul, the “Twin Cities,” are home to 19Fortune 500 companies in industries driven by commerce,finance, healthcare and high-tech companies. The diverse11-county metro area has an annual population growthof 2-3%, a highly educated workforce and low rates ofunemployment, producing a stable environment even duringunpredictable times.Vacancy rose steadily throughout 2009 as rental ratesdecreased slightly in all property types. Office vacancymarket-wide is 14% with the highest vacancy in Class Bspace. Industrial vacancy sits at 10% and retail vacancy isabout 5%. Tenants exercise caution when it comes toleasing or acquiring new space, renewing existing leasesrather than absorbing relocation costs. Landlords are offeringdiscounted rates to tenants renewing 12 to 18 months inadvance to ensure spaces remain filled.Leases of 10,000 SF or less are driving the industrial marketas retail spaces vacated in late 2008 and early 2009 arefilled by a host of new eateries. Major leases this yearincluded a 929,800 SF Target Corporation office renewal,the 300,000 SF Silgan Containers industrial lease and the30,000 SF Home Valu Interiors retail lease.<strong>Market</strong> activity has grown throughout 2009 and willcontinue in <strong>2010</strong>. Movement is due to consolidation anddownsizing, as opposed to actual growth. There is a largeamount of “shadow” space in industrial and office segmentsas companies downsized but did not release unused space.That space needs to be filled before new construction demandwill return. Top construction projects under way in2009 were the Excelsior Crossings Office Park – Bldg. C,2201 W 94th Ave. in Bloomington and BMW of Minnetonka.Transaction volumes are down as are pricing and value.Looking ahead, we'll see more foreclosures, forced salesand increased transactional activity as lenders liquidateassets. The largest sales in 2009 included the 116,000 SFSyngenta Headquarters office building in Hopkins, the335,400 SF industrial building located at 13201 N WilfredLane in Rogers, and the 97,535 SF Hastings <strong>Market</strong>place.Contact<strong>NAI</strong> Capital <strong>Real</strong>tyKansas City+1 913 469 4600Metropolitan AreaEconomic Overview2009Population2014 EstimatedPopulationEmploymentPopulationHouseholdAverage IncomeMedianHousehold IncomeTotal PopulationMedian Age2,016,6622,095,1041,127,170$68,837$59,54137Kansas City, a bi-state community of over 2,000,000 people,ranks in the top half nationwide for growth during therecession. Bioscience, healthcare and bulk distribution havebeen key performers. The industrial sector remains healthywith 7.25% vacancy and a fairly narrow margin betweenquoted and negotiated lease rates. Coleman’s 1,100,000SF distribution center opened at year-end 2009. BNSF/AllenGroup’s intermodal project in Johnson County, Kansas isproceeding in Edgerton with support from the city, countyand state.The CenterPoint/KC Southern Railway intermodal center atthe former Richards-Gebaur Airport is advancing. Phase Iopened in spring 2008 with $30 million site grading, streets,sewers and utilities. This intermodal serves as an alternativeto the congested Los Angeles port system by shipping fromMexico’s Port of Lazaro Cardena, an increasingly significantgateway for imports from Asia.Kansas City’s office market vacancy increased throughoutmost submarkets in 2009. However, this sector is projectedto begin improving in late <strong>2010</strong>. The south Johnson County,Kansas submarket, the metro’s most active, should reboundfirst. Large sublease offerings were a factor in increasedincentives and depressed rates.Healthcare, bioscience research and telecommunicationsimpact demand. Two of the largest transactions occurred atSprint’s headquarters with healthcare companies ApriaHealthcare and Care Centrix opening new operations.Telecommunication companies Sprint and CenturyLink(formerly Embarq) offered large blocks of space new to themarket at Sprint’s Headquarters and CenturyTel’s premisesat Glenwood Place.The Wizards soccer team is flipping its stadium developmentalong with a significant Cerner Corporation office projectfrom Missouri to Kansas. Developers are moving forward atVillage West/Kansas Speedway in Kansas City, Kansas dueto greater economic incentives available in Kansas. Cernerwill create up to 4,000 jobs in this development, the largestjobs influx in Kansas City Kansas in years.The retail sector slowed dramatically in 2009 and improvementis unlikely until at least 2011. Corbin Park in OverlandPark opened with Von Maur, but has since encounterednumerous contractors’ liens and minimal leasing. Lee’sSummit’s Summit Fair, a 395,000 SF lifestyle centeropened, anchored by Macy’s and JC Penney.Minneapolis/St. Paul At A Glance(Rent/SF/YR) Low High Effective Avg. VacancyDOWNTOWN OFFICENew Construction (AAA)Class A (Prime)Class B (Secondary)SUBURBAN OFFICENew Construction (AAA)Class A (Prime)Class B (Secondary)INDUSTRIALBulk WarehouseManufacturingHigh Tech/R&DRETAILDowntownNeighborhood Service CentersCommunity Power CenterRegional Malls$$$$$$$$$$$N/A15.0014.00N/A13.002.382.502.503.0010.005.003.507.00$$$$$$$$$$$N/A24.0055.00N/A31.0060.0014.7511.0025.7125.0037.0032.0070.00$$$$$$$$$$$N/A18.4517.97N/A20.7017.795.915.767.2416.8313.8611.3214.73N/A11.0%13.4%N/A9.8%10.0%10.2%7.9%15.5%5.0%7.8%6.3%1.5%DEVELOPMENT LAND Low/Acre High/AcreOffice in CBDLand in Office ParksLand in Industrial ParksOffice/Industrial Land - Non-parkRetail/<strong>Commercial</strong> LandResidentialN/AN/AN/AN/AN/AN/AN/AN/AN/AN/AN/AN/AKansas City At A Glance(Rent/SF/YR) Low High Effective Avg. VacancyDOWNTOWN OFFICEPremium (AAA)Class A (Prime)Class B (Secondary)SUBURBAN OFFICENew Construction (AAA)Class A (Prime)Class B (Secondary)INDUSTRIALBulk WarehouseManufacturingHigh Tech/R&DRETAILDowntownNeighborhood Service CentersCommunity Power CenterRegional Malls$$$$$$$$$$$$N/A18.0014.5028.5020.5015.003.552.654.509.006.206.4512.00$$$$$$$$$$$$N/A23.5020.0028.5028.5021.005.606.4017.8526.0023.5028.2533.50$$$$$$$$$$$$N/A18.6417.1328.5020.8117.703.923.458.0017.8812.8017.0118.24N/A24.0%18.2%100.0%19.1%16.4%5.9%7.3%15.5%7.8%13.2%7.6%8.9%DEVELOPMENT LAND Low HighOffice in CBD (per square foot)Land in Office Parks (per acre)Land in Industrial Parks (per acre)Office/Industrial Land - Non-park (per acre)Retail/<strong>Commercial</strong> Land (per acre)Residential (per acre)$ 40.00 $ 75.00$ 150,000.00 $ 480,000.00$ 40,000.00 $ 200,000.00$ 35,000.00 $ 175,000.00$ 26,000.00 $ 1,050,000.00N/AN/A<strong>2010</strong> <strong>Global</strong> <strong>Market</strong> <strong>Report</strong> ■ www.naiglobal.com 100
- Page 1 and 2:
CommercialCommercial Real Estate Se
- Page 3 and 4:
■ ■ ■ Table of ContentsGENERA
- Page 5 and 6:
Global OutlookCommercial real estat
- Page 7 and 8:
38.3% in November 2009. At the same
- Page 9 and 10:
quality than the Census properties.
- Page 11 and 12:
SaskatchewanSaskatchewan is a small
- Page 13 and 14:
As 2009 draws to a close, there is
- Page 15 and 16:
Global investment interest largely
- Page 18 and 19:
ChinaChina continued to post large
- Page 20 and 21:
MalaysiaWith Malaysia’s dependenc
- Page 22 and 23:
■ US Highlights - Northeast Regio
- Page 24 and 25:
■ US Highlights - Midwest Region
- Page 26 and 27:
■ US Highlights - West Region■
- Page 28 and 29:
Melbourne, AustraliaBeijing, ChinaC
- Page 30 and 31:
Shanghai, ChinaXiamen, ChinaContact
- Page 32 and 33:
Delhi, Gurgaon, IndiaHyderabad, Pra
- Page 34 and 35:
Punjab, IndiaTokyo, JapanContactNAI
- Page 36 and 37:
Seoul, South KoreaTaipei, TaiwanCon
- Page 38 and 39:
Calgary, Alberta, CanadaEdmonton, A
- Page 40 and 41:
Halifax, Nova Scotia, CanadaOttawa,
- Page 42 and 43:
Regina, Saskatchewan, CanadaContact
- Page 44 and 45:
Vienna, AustriaThe Baltics (Latvia/
- Page 46 and 47:
Copenhagen, DenmarkFinlandContactNA
- Page 48 and 49:
Athens, GreeceReykjavik IcelandCont
- Page 50 and 51: KuwaitOslo, NorwayContactNAI Kuwait
- Page 52 and 53: Moscow, Russian FederationSt. Peter
- Page 54 and 55: Madrid, SpainStockholm, SwedenConta
- Page 56 and 57: Istanbul, TurkeyKiev, UkraineContac
- Page 58 and 59: Latin AmericaSECTION CONTENTSBuenos
- Page 60 and 61: Campinas, BrazilCuritiba, BrazilCon
- Page 62 and 63: Sao Paulo, BrazilSantiago, ChileCon
- Page 64 and 65: Ciudad Juarez, Chihuahua, MexicoGua
- Page 66 and 67: Matamoros, Tamaulipas, MexicoMexica
- Page 68 and 69: Reynosa, MexicoSaltillo, Coahuila,
- Page 70 and 71: Torreon, Coahulia, MexicoCaracas, V
- Page 72 and 73: Birmingham, AlabamaHuntsville, Deca
- Page 74 and 75: Jonesboro, ArkansasLittle Rock, Ark
- Page 76 and 77: Marin County, CaliforniaMonterey, C
- Page 78 and 79: Sacramento, CaliforniaSan Diego, Ca
- Page 80 and 81: Santa Clara County (Silicon Valley)
- Page 82 and 83: Colorado Springs, ColoradoDenver, C
- Page 84 and 85: Fort Lauderdale, FloridaFt. Myers/N
- Page 86 and 87: Miami, FloridaOrlando, FloridaConta
- Page 88 and 89: Atlanta, GeorgiaHonolulu, HawaiiCon
- Page 90 and 91: Chicago, IllinoisSpringfield, Illin
- Page 92 and 93: Cedar Rapids, Iowa City, IowaDavenp
- Page 94 and 95: Wichita, KansasLexington, KentuckyC
- Page 96 and 97: Monroe, LouisianaNew Orleans, Louis
- Page 98 and 99: Suburban MarylandBoston, Massachuse
- Page 102 and 103: St. Louis, MissouriBozeman, Montana
- Page 104 and 105: Omaha, NebraskaLas Vegas, NevadaCon
- Page 106 and 107: Portsmouth, New HampshireAtlantic C
- Page 108 and 109: Ocean/Monmouth Counties (“Shore M
- Page 110 and 111: Las Cruces, New MexicoAlbany, New Y
- Page 112 and 113: Asheville, North CarolinaCharlotte,
- Page 114 and 115: Fargo, North DakotaAkron, OhioConta
- Page 116 and 117: Cleveland, OhioColumbus, OhioContac
- Page 118 and 119: Tulsa, OklahomaPortland, OregonCont
- Page 120 and 121: Bucks County, PennsylvaniaHarrisbur
- Page 122 and 123: Pittsburgh, PennsylvaniaSchuylkill
- Page 124 and 125: Greenville/Spartanburg/Anderson Cou
- Page 126 and 127: Knoxville, TennesseeMemphis, Tennes
- Page 128 and 129: Beaumont, TexasCorpus Christi, Texa
- Page 130 and 131: Fort Worth, TexasHouston, TexasCont
- Page 132 and 133: Texarkana (Bowie County, Texas/Mill
- Page 134 and 135: Northern VirginiaSeattle/Puget Soun
- Page 136 and 137: Madison, WisconsinMilwaukee, Wiscon
- Page 138 and 139: Jackson Hole, WyomingContactNAI Jac
- Page 140: Build on the power of our network.N


