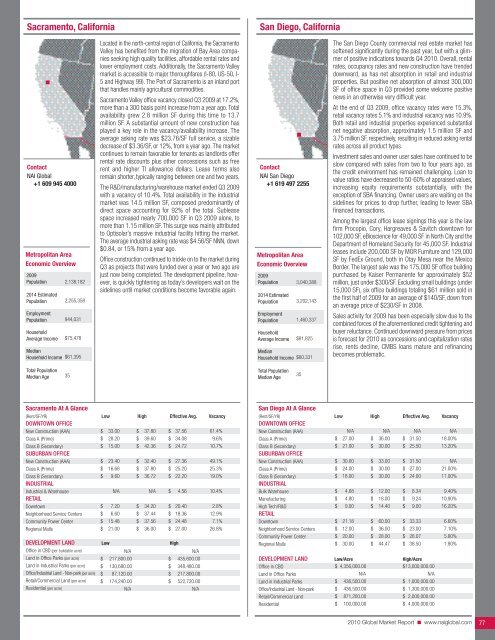
Sacramento, CaliforniaSan Diego, CaliforniaContact<strong>NAI</strong> <strong>Global</strong>+1 609 945 4000Metropolitan AreaEconomic Overview2009Population2014 EstimatedPopulationEmploymentPopulationHouseholdAverage IncomeMedianHousehold Income2,138,1822,255,358944,031$75,478$61,395Located in the north-central region of California, the SacramentoValley has benefited from the migration of Bay Area companiesseeking high quality facilities, affordable rental rates andlower employment costs. Additionally, the Sacramento Valleymarket is accessible to major thoroughfares (I-80, US-50, I-5 and Highway 99). The Port of Sacramento is an inland portthat handles mainly agricultural commodities.Sacramento Valley office vacancy closed Q3 2009 at 17.2%,more than a 300 basis point increase from a year ago. Totalavailability grew 2.8 million SF during this time to 13.7million SF. A substantial amount of new construction hasplayed a key role in the vacancy/availability increase. Theaverage asking rate was $23.76/SF full service, a sizabledecrease of $3.36/SF, or 12%, from a year ago. The marketcontinues to remain favorable for tenants as landlords offerrental rate discounts plus other concessions such as freerent and higher TI allowance dollars. Lease terms alsoremain shorter, typically ranging between one and two years.The R&D/manufacturing/warehouse market ended Q3 2009with a vacancy of 10.4%. Total availability in the industrialmarket was 14.5 million SF, composed predominantly ofdirect space accounting for 92% of the total. Subleasespace increased nearly 700,000 SF in Q3 2009 alone, tomore than 1.15 million SF. This surge was mainly attributedto Optisolar’s massive industrial facility hitting the market.The average industrial asking rate was $4.56/SF NNN, down$0.84, or 15% from a year ago.Office construction continued to trickle on to the market duringQ3 as projects that were funded over a year or two ago arejust now being completed. The development pipeline, however,is quickly tightening as today’s developers wait on thesidelines until market conditions become favorable again.Contact<strong>NAI</strong> San Diego+1 619 497 2255Metropolitan AreaEconomic Overview2009Population2014 EstimatedPopulationEmploymentPopulationHouseholdAverage IncomeMedianHousehold Income3,040,3883,202,1431,460,337$81,825$60,331The San Diego County commercial real estate market hassoftened significantly during the past year, but with a glimmerof positive indications towards Q4 <strong>2010</strong>. Overall, rentalrates, occupancy rates and new construction have trendeddownward, as has net absorption in retail and industrialproperties. But positive net absorption of almost 300,000SF of office space in Q3 provided some welcome positivenews in an otherwise very difficult year.At the end of Q3 2009, office vacancy rates were 15.3%,retail vacancy rates 5.1% and industrial vacancy was 10.9%.Both retail and industrial properties experienced substantialnet negative absorption, approximately 1.5 million SF and3.75 million SF, respectively, resulting in reduced asking rentalrates across all product types.Investment sales and owner user sales have continued to beslow compared with sales from two to four years ago, asthe credit environment has remained challenging. Loan tovalue ratios have decreased to 50-60% of appraised values,increasing equity requirements substantially, with theexception of SBA financing. Owner users are waiting on thesidelines for prices to drop further, leading to fewer SBAfinanced transactions.Among the largest office lease signings this year is the lawfirm Procopio, Cory, Hargreaves & Savitch downtown for102,000 SF, eBioscience for 49,000 SF in North City and theDepartment of Homeland Security for 45,000 SF. Industrialleases include 200,000 SF by MOR Furniture and 129,000SF by FedEx Ground, both in Otay Mesa near the MexicoBorder. The largest sale was the 175,000 SF office buildingpurchased by Kaiser Permanente for approximately $52million, just under $300/SF. Excluding small buildings (under15,000 SF), six office buildings totaling $61 million sold inthe first half of 2009 for an average of $140/SF, down froman average price of $230/SF in 2008.Sales activity for 2009 has been especially slow due to thecombined forces of the aforementioned credit tightening andbuyer reluctance. Continued downward pressure from pricesis forecast for <strong>2010</strong> as concessions and capitalization ratesrise, rents decline, CMBS loans mature and refinancingbecomes problematic.Total PopulationMedian Age35Total PopulationMedian Age35Sacramento At A Glance(Rent/SF/YR) Low High Effective Avg. VacancyDOWNTOWN OFFICENew Construction (AAA)Class A (Prime)Class B (Secondary)SUBURBAN OFFICENew Construction (AAA)Class A (Prime)Class B (Secondary)INDUSTRIALIndustrial & WarehouseRETAILDowntownNeighborhood Service CentersCommunity Power CenterRegional Malls$$$$$$$$$$33.0028.2015.0023.4016.689.60N/A7.206.6015.4821.00$$$$$$$$$$37.8039.6042.3632.4037.8036.72N/A34.2037.4437.5636.00$$$$$$$$$$$37.5634.0824.7227.3625.2022.204.5620.4018.3624.4827.0061.4%9.6%10.7%49.1%25.3%19.0%10.4%2.8%12.9%7.1%26.8%DEVELOPMENT LAND Low HighOffice in CBD (per buildable acre)Land in Office Parks (per acre)Land in Industrial Parks (per acre)Office/Industrial Land - Non-park (per acre)Retail/<strong>Commercial</strong> Land (per acre)Residential (per acre)$$$$N/A217,800.00130,680.0087,120.00174,240.00N/A$$$$N/A435,600.00348,480.00217,800.00522,720.00N/ASan Diego At A Glance(Rent/SF/YR) Low High Effective Avg. VacancyDOWNTOWN OFFICENew Construction (AAA)Class A (Prime)Class B (Secondary)SUBURBAN OFFICENew Construction (AAA)Class A (Prime)Class B (Secondary)INDUSTRIALBulk WarehouseManufacturingHigh Tech/R&DRETAILDowntownNeighborhood Service CentersCommunity Power CenterRegional Malls$$$$$$$$$$$$N/A27.0021.0030.0024.0018.004.684.809.0021.1812.0020.0030.00$$$$$$$$$$$$N/A36.0030.0033.0030.0030.0012.0018.0014.4060.0036.0028.0044.47$$$$$$$$$$$$N/A31.5025.5031.5027.0024.008.349.249.0033.3323.0028.0738.50N/A18.00%13.20%N/A21.00%11.00%9.40%10.90%16.20%6.60%7.10%5.80%1.80%DEVELOPMENT LAND Low/Acre High/AcreOffice in CBDLand in Office Parks$ 4,356,000.00N/A$13,000,000.00N/ALand in Industrial ParksOffice/Industrial Land - Non-parkRetail/<strong>Commercial</strong> LandResidential$$$$436,500.00436,500.00871,200.00100,000.00$ 1,000,000.00$ 1,300,000.00$ 2,000,000.00$ 4,000,000.00<strong>2010</strong> <strong>Global</strong> <strong>Market</strong> <strong>Report</strong> ■ www.naiglobal.com 77
San Francisco County, CaliforniaSan Mateo County, CaliforniaContact<strong>NAI</strong> <strong>Global</strong>+1 609 945 4000Metropolitan AreaEconomic Overview2009Population2014 EstimatedPopulationEmploymentPopulationHouseholdAverage IncomeMedianHousehold IncomeTotal PopulationMedian Age4,249,6444,362,6442,274,988$100,489$77,44040The San Francisco commercial market remained plagued byrising vacancy, declining rents and occupancy loss with theSeptember 2009 preliminary unemployment rate reaching10.4%. The market-wide vacancy rate rose to 15.3% at theend of 3rd quarter 2009. The San Francisco office marketcontinued to experience deterioration, though at a continuinglesser pace, despite signs of increased leasing activityas major companies looked to lock in long-term deals andtake advantage of attractive rents with generous concessionscurrently offered by Landlords. The market-widevacancy rate rose to 15.3% at the end of 3rd quarter 2009.The overall market continued to show occupancy lossending Q3 at 247,870 SF of negative net absorption. Theyear-to-date total amounted to nearly 1.7 million square feetof negative absorption, already exceeding 2008’s annualtotal of negative 1.3 million square feet. The overall annualmarket rental rates dropped $3.75 to $33.01 per squarefoot full service.The amount of sublease space remained flat during the3rd quarter at about 2.7 million square feet, or 3.2% ofthe total building inventory, showing early signs of somecompanies now shedding less excess space onto thesublease market and other companies leasing up thebargain sublease opportunities.San Francisco’s industrial/warehouse market contains 19.3million sf of base and includes users in both distribution andmanufacturing industries. The overall market-wide vacancyrate rose to 5.1% as it lost occupancy at negative 110,500square feet of net activity. Year-to-date net absorption hasalready tallied a negative 413,180 square feet, nearly equivalentto its highest amount of annual occupancy loss seenin 2001. <strong>Market</strong>-wide industrial asking rates dropped lowerto $0.76 per square foot industrial gross. The marketrecovery still remains to be seen. The availability rate isexpected to continue to go up as demand remains slow.San Francisco’s first quarter 2009 retail vacancy rate wasthe lowest in the country at 2 percent, remaining unchangedfrom year end 2008, and far below the national average of7.2 percent. Average asking rates dropped 4.6 percent to$38.14 per square foot. Of the top metropolitan areasthroughout the country, San Francisco’s low vacancy rate isreflective of our individual market demand in our supplyconstrainedurban environment.Contact<strong>NAI</strong> <strong>Global</strong>+1 609 945 4000Metropolitan AreaEconomic Overview2009Population2014 EstimatedPopulationEmploymentPopulationHouseholdAverage IncomeMedianHousehold IncomeTotal PopulationMedian Age709,558715,897374,088$116,511$89,76340.8San Mateo County is home to the San Francisco InternationalAirport and some of the world’s leading technologycompanies. World-class universities, world-class culturalvenues, a diverse labor pool and abundant intellectualresources of working capital make this region one of thebest locations to conduct business in the United States.San Mateo office vacancy peaked above 18% in 2009,climbing 680 basis points from 2008. The average askingrate decreased a dramatic $10.32 in the past year to$31.92/SF per year for full service properties. Since 2007,nearly 5.7 million SF of office space has been absorbed fromSan Mateo County's available marketplace. The city of SouthSan Francisco’s vacancy rate remained high at 25.7% inQ3 2009 compared to 26.4% a year ago and 13.9% in2007. Belmont/San Carlos also remains among the highestin San Mateo County at 24.9%.R&D vacancy continues to increase, closing Q3 2009 at16.11%, an increase of 239 basis points from 2008. Theaverage asking rate closed Q3 2009 at $27.96/SF NNN peryear, down $2.88 from 2008. The County has recorded over36,000 SF of negative net activity year-to-date in 2009.Manufacturing vacancy closed Q3 2009 at 4.57% with anaverage asking rate of $10.68/SF NNN. San Mateo County’swarehouse vacancy pushed into double-digit territory from5.3% in Q3 2008 to 11.0% in Q3 2009. The average askingrate closed Q3 2009 at $9.24/SF NNN. In the past year, thewarehouse market has absorbed 2 million SF of inventory.Future retail developments include a redevelopment andnew construction at 1450 Howard Avenue in Burlingamewith a new 44,000 SF Safeway store with an additional13,000 SF of retail space.San Francisco At A Glance(Rent/SF/YR) Low High Effective Avg. VacancyDOWNTOWN OFFICENew Construction (AAA)Class A (Prime)Class B (Secondary)SUBURBAN OFFICENew Construction (AAA)Class A (Prime)Class B (Secondary)INDUSTRIALBulk WarehouseManufacturingHigh Tech/R&DRETAIL$$$N/A19.0018.00N/AN/AN/A5.40N/AN/A$$$N/A70.0040.00N/AN/AN/A16.20N/AN/A$$2$N/A36.428.72N/AN/AN/A9.12N/AN/AN/A14.4%13.8%N/AN/AN/A5.1%N/AN/ADowntown$ 28.50 $ 750.00 $ 76.33 6.7%Neighborhood Service CentersCommunity Power Center$ 28.20N/A$ 65.00N/A$ 45.06N/A3.6%N/ARegional Malls$ 24.00 $ 150.00 $ 71.37 1.5%DEVELOPMENT LAND Low HighOffice in CBD (per buildableSF)Land in Office Parks (per acre)Land in Industrial Parks (per acre)Office/Industrial Land - Non-park (per acre)Retail/<strong>Commercial</strong> Land (per acre)Residential (per acre)N/AN/AN/A$ 1,700,000.00$ 1,800,000.00$ 2,000,000.00N/AN/AN/A$ 6,000,000.00$ 10,000,000.00$ 13,000,000.00San Mateo County At A Glance(Rent/SF/YR) Low High Effective Avg. VacancyDOWNTOWN OFFICENew Construction (AAA)Class A (Prime)Class B (Secondary)SUBURBAN OFFICENew Construction (AAA)Class A (Prime)$N/AN/AN/AN/A11.40N/AN/AN/AN/A$ 162.00N/AN/AN/AN/A$ 35.04N/AN/AN/AN/A18.7%Class B (Secondary)INDUSTRIAL$ 6.00 $ 66.00 $ 25.20 24.8%Bulk WarehouseManufacturing$$4.564.56$$18.0018.00$$9.489.2413.5%11.0%High Tech/R&DRETAILDowntownNeighborhood Service CentersCommunity Power CenterRegional Malls$$$9.00N/A18.0015.00N/A$$$45.00N/A54.0045.00N/A$ 27.96N/A$ 33.66$ 27.49N/A16.1%N/A3.8%5.1%N/ADEVELOPMENT LAND Low HighOffice in CBD (per buildable acre)Land in Office Parks (per acre)Land in Industrial Parks (per acre)Office/Industrial Land - Non-park (per acre)Retail/<strong>Commercial</strong> Land (per acre)Residential (per acre)$ 111.00 $ 870.00$ 1,500,000.00 $ 2,300,000.00$ 1,100,000.00 $ 2,645,000.00$ 1,110,000.00 $ 2,900,000.00$ 4,200,000.00 $ 5,500,000.00$ 775,000.00 $ 9,032,000.00<strong>2010</strong> <strong>Global</strong> <strong>Market</strong> <strong>Report</strong> ■ www.naiglobal.com 78
- Page 1 and 2:
CommercialCommercial Real Estate Se
- Page 3 and 4:
■ ■ ■ Table of ContentsGENERA
- Page 5 and 6:
Global OutlookCommercial real estat
- Page 7 and 8:
38.3% in November 2009. At the same
- Page 9 and 10:
quality than the Census properties.
- Page 11 and 12:
SaskatchewanSaskatchewan is a small
- Page 13 and 14:
As 2009 draws to a close, there is
- Page 15 and 16:
Global investment interest largely
- Page 18 and 19:
ChinaChina continued to post large
- Page 20 and 21:
MalaysiaWith Malaysia’s dependenc
- Page 22 and 23:
■ US Highlights - Northeast Regio
- Page 24 and 25:
■ US Highlights - Midwest Region
- Page 26 and 27:
■ US Highlights - West Region■
- Page 28 and 29: Melbourne, AustraliaBeijing, ChinaC
- Page 30 and 31: Shanghai, ChinaXiamen, ChinaContact
- Page 32 and 33: Delhi, Gurgaon, IndiaHyderabad, Pra
- Page 34 and 35: Punjab, IndiaTokyo, JapanContactNAI
- Page 36 and 37: Seoul, South KoreaTaipei, TaiwanCon
- Page 38 and 39: Calgary, Alberta, CanadaEdmonton, A
- Page 40 and 41: Halifax, Nova Scotia, CanadaOttawa,
- Page 42 and 43: Regina, Saskatchewan, CanadaContact
- Page 44 and 45: Vienna, AustriaThe Baltics (Latvia/
- Page 46 and 47: Copenhagen, DenmarkFinlandContactNA
- Page 48 and 49: Athens, GreeceReykjavik IcelandCont
- Page 50 and 51: KuwaitOslo, NorwayContactNAI Kuwait
- Page 52 and 53: Moscow, Russian FederationSt. Peter
- Page 54 and 55: Madrid, SpainStockholm, SwedenConta
- Page 56 and 57: Istanbul, TurkeyKiev, UkraineContac
- Page 58 and 59: Latin AmericaSECTION CONTENTSBuenos
- Page 60 and 61: Campinas, BrazilCuritiba, BrazilCon
- Page 62 and 63: Sao Paulo, BrazilSantiago, ChileCon
- Page 64 and 65: Ciudad Juarez, Chihuahua, MexicoGua
- Page 66 and 67: Matamoros, Tamaulipas, MexicoMexica
- Page 68 and 69: Reynosa, MexicoSaltillo, Coahuila,
- Page 70 and 71: Torreon, Coahulia, MexicoCaracas, V
- Page 72 and 73: Birmingham, AlabamaHuntsville, Deca
- Page 74 and 75: Jonesboro, ArkansasLittle Rock, Ark
- Page 76 and 77: Marin County, CaliforniaMonterey, C
- Page 80 and 81: Santa Clara County (Silicon Valley)
- Page 82 and 83: Colorado Springs, ColoradoDenver, C
- Page 84 and 85: Fort Lauderdale, FloridaFt. Myers/N
- Page 86 and 87: Miami, FloridaOrlando, FloridaConta
- Page 88 and 89: Atlanta, GeorgiaHonolulu, HawaiiCon
- Page 90 and 91: Chicago, IllinoisSpringfield, Illin
- Page 92 and 93: Cedar Rapids, Iowa City, IowaDavenp
- Page 94 and 95: Wichita, KansasLexington, KentuckyC
- Page 96 and 97: Monroe, LouisianaNew Orleans, Louis
- Page 98 and 99: Suburban MarylandBoston, Massachuse
- Page 100 and 101: Grand Rapids, MichiganLansing, Mich
- Page 102 and 103: St. Louis, MissouriBozeman, Montana
- Page 104 and 105: Omaha, NebraskaLas Vegas, NevadaCon
- Page 106 and 107: Portsmouth, New HampshireAtlantic C
- Page 108 and 109: Ocean/Monmouth Counties (“Shore M
- Page 110 and 111: Las Cruces, New MexicoAlbany, New Y
- Page 112 and 113: Asheville, North CarolinaCharlotte,
- Page 114 and 115: Fargo, North DakotaAkron, OhioConta
- Page 116 and 117: Cleveland, OhioColumbus, OhioContac
- Page 118 and 119: Tulsa, OklahomaPortland, OregonCont
- Page 120 and 121: Bucks County, PennsylvaniaHarrisbur
- Page 122 and 123: Pittsburgh, PennsylvaniaSchuylkill
- Page 124 and 125: Greenville/Spartanburg/Anderson Cou
- Page 126 and 127: Knoxville, TennesseeMemphis, Tennes
- Page 128 and 129:
Beaumont, TexasCorpus Christi, Texa
- Page 130 and 131:
Fort Worth, TexasHouston, TexasCont
- Page 132 and 133:
Texarkana (Bowie County, Texas/Mill
- Page 134 and 135:
Northern VirginiaSeattle/Puget Soun
- Page 136 and 137:
Madison, WisconsinMilwaukee, Wiscon
- Page 138 and 139:
Jackson Hole, WyomingContactNAI Jac
- Page 140:
Build on the power of our network.N


