Santa Clara County (Silicon Valley), CaliforniaSanta Cruz County, CaliforniaContact<strong>NAI</strong> <strong>Global</strong>+1 609 945 4000Metropolitan AreaEconomic Overview2009Population2014 EstimatedPopulationEmploymentPopulationHouseholdAverage Income1,837,7791,922,925956,264$111,629Santa Clara County has one of the highest median familyincomes and boasts some of the highest rated educationalsystems nationwide. Many consider this county one of thebest places in the country to live and work. This area had beena main target for new office/R&D development in recent years,but due to weak demand stemming from economic declineand rising unemployment, developers have halted most newprojects altogether or until the economy recovers.Silicon Valley office vacancy hit 19.1% in Q3 2009compared to 13.6% a year ago, while availability was 14.2million SF, compared to 9.8 million SF in 2008. Both arerecord high levels. The average asking rate slid $2.04 thepast year to $32.76/SF per year for full service properties.R&D vacancy also grew to 19.1% in Q3 2009, a heftyincrease of 5.7 million SF from 15.6% a year ago. Theaverage asking rate was $12.96/SF NNN, down $2.52from Q3 2008. The velocity in these sectors softened anddecelerated as Q2 and Q3 consecutively fared much betterthan the horrendous Q1 2009.Manufacturing vacancy was 8.35% with an average askingrate of $8.16/SF NNN in the Q3 2009, while warehousevacancy was 8.85% with an average asking rate of $5.16/SFNNN. Both vacancies are up and both asking rates are downfrom a year ago. Notably, warehousing did note a reductionin vacancy and positive net absorption in the Q3 2009.Silicon Valley sales activity has been very anemic, though ithas accounted for a good portion of the total activity in theBay area and minor quarterly up-ticks have recently beenrealized. <strong>Report</strong>s indicate Silicon Valley has the least amountof distressed real estate nationwide.We are still a few quarters from the market's bottom, butthe Silicon Valley has several economic and employmentadvantages compared to other areas in the country andshould be positioned well ahead of the curve for commercialrecovery once we experience sustainable economic recoveryand job growth.Contact<strong>NAI</strong> <strong>Global</strong>+1 609 945 4000Metropolitan AreaEconomic Overview2009Population2014 EstimatedPopulationEmploymentPopulationHouseholdAverage Income255,778265,553117,912$85,822Santa Cruz County, an area rich in natural beauty, covers439 square miles, making it the second smallest county byarea in California. With its six state parks, attractive beachesand famous Santa Cruz beach boardwalk, the countyremains one of the West Coast’s most famous seaside playgrounds.The economy is still largely dependent on seasonaltourism and agriculture, but is becoming more diversifiedwith businesses in the high-tech, software and educationalindustries.In accordance with the slumping economy, Santa CruzCounty office/R&D vacancy increased for eight consecutivequarters, rising from 9.8% in Q3 2007 to 12.9% in Q32009. Meanwhile, the average asking rate fell by $1.20/SFover the past year to $22.32/SF for full service properties.Total availability grew to 954,000 SF countywide in Q32009. This market has not hit the 1 million SF mark since2004. Sublease space totaled 134,000 SF, or 14% of thecounty’s total office availability, compared to 185,000 SF,or 23%, a year ago. Through the first three quarters of2009, reported net absorption totaled a negative 153,200SF, more than the total negative net activity of 2008 and2007 combined.Manufacturing/warehouse vacancy grew to 5.1% in Q32009, up from 3.9% a year ago. The industrial market had560,000 SF available in Q3, with roughly 10% composed ofsublease space. Sublease space nearly tripled from 2008.The average asking rate for industrial product was $8.88/SFNNN in Q3 2009, a sharp decline of $1.56/SF from 2008.Net absorption was negative 170,000 SF through the firstthree quarters of 2009, its most critical level since 2002.One positive trend for Santa Cruz County was the fall ofunemployment rates in Q2 and Q3, after reaching a high of13.5% in Q1 2009. However, unemployment did still remainin the upper 10% range at the close of Q3 2009.MedianHousehold Income$93,182MedianHousehold Income$67,389Total PopulationMedian Age37Total PopulationMedian Age38Santa Clara County At A Glance(Rent/SF/YR) Low High Effective Avg. VacancyDOWNTOWN OFFICENew Construction (AAA)Class A (Prime)Class B (Secondary)SUBURBAN OFFICENew Construction (AAA)Class A (Prime)Class B (Secondary)INDUSTRIAL$$$$$$54.0025.2015.0030.0018.0015.48$$$$$$99.6085.2066.0084.0078.9661.20$ 50.92$ 43.44$ 27.00$ 57.00$ 35.60$ 26.8898.5%24.1%18.2%100.0%23.9%13.7%Bulk WarehouseManufacturing$$2.402.64$$8.4023.40$$5.168.168.9%8.4%High Tech/R&DRETAILDowntownNeighborhood Service CentersCommunity Power Center$$$$3.4824.0024.0027.00$$$$46.8072.0048.0060.00$ 12.96$ 48.00$ 36.00$ 43.5019.1%N/AN/AN/ARegional Malls$ 45.00 $ 125.00 $ 85.00 N/ADEVELOPMENT LAND Low/Acre High/AcreOffice in CBD$ 1,306,800.00 $ 3,310,560.00Land in Office ParksLand in Industrial Parks$$871,200.00653,400.00$ 2,178,000.00$ 1,306,800.00Office/Industrial Land - Non-parkRetail/<strong>Commercial</strong> Land$ 1,306,800.00$ 1,089,000.00$ 1,742,400.00$ 1,742,400.00Residential$ 653,400.00 $ 1,960,200.00Santa Cruz County At A Glance(Rent/SF/YR) Low High Effective Avg. VacancyDOWNTOWN OFFICENew Construction (AAA)Class A (Prime)Class B (Secondary)SUBURBAN OFFICENew Construction (AAA)$$N/A24.0013.68N/A$$N/A28.8025.20N/AN/A$ 25.68$ 22.20N/AN/A40.1%7.1%N/AClass A (Prime)Class B (Secondary)INDUSTRIAL$18.60$12.00$$28.2027.00$ 23.28$ 21.8415.8%10.5%Bulk Warehouse$ 3.60 $ 12.00 $ 7.08 4.7%ManufacturingHigh Tech/R&DRETAILDowntownNeighborhood Service CentersCommunity Power CenterRegional Malls$$$$4.6811.4018.0012.00N/AN/A$$$$16.2018.6042.0027.00N/AN/A$ 10.08$ 12.24N/AN/AN/AN/A5.4%14.7%N/AN/AN/AN/ADEVELOPMENT LAND Low/Acre High/AcreOffice in CBDLand in Office ParksLand in Industrial Parks$ 1,300,000.00N/AN/A$ 3,200,000.00N/AN/AOffice/Industrial Land - Non-parkRetail/<strong>Commercial</strong> LandResidential$ 522,000.00N/AN/A$ 1,500,000.00N/AN/A<strong>2010</strong> <strong>Global</strong> <strong>Market</strong> <strong>Report</strong> ■ www.naiglobal.com 79
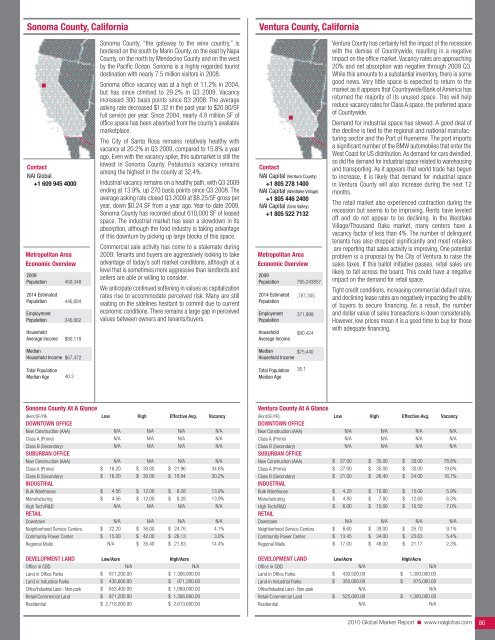
Sonoma County, CaliforniaVentura County, CaliforniaContact<strong>NAI</strong> <strong>Global</strong>+1 609 945 4000Metropolitan AreaEconomic Overview2009Population2014 EstimatedPopulationEmploymentPopulationHouseholdAverage Income459,348446,684240,062$80,118Sonoma County, “the gateway to the wine country,” isbordered on the south by Marin County, on the east by NapaCounty, on the north by Mendocino County and on the westby the Pacific Ocean. Sonoma is a highly regarded touristdestination with nearly 7.5 million visitors in 2008.Sonoma office vacancy was at a high of 11.2% in 2004,but has since climbed to 29.2% in Q3 2009. Vacancyincreased 300 basis points since Q3 2008. The averageasking rate decreased $1.32 in the past year to $20.80/SFfull service per year. Since 2004, nearly 4.8 million SF ofoffice space has been absorbed from the county’s availablemarketplace.The City of Santa Rosa remains relatively healthy withvacancy at 20.2% in Q3 2009, compared to 15.8% a yearago. Even with the vacancy spike, this submarket is still thelowest in Sonoma County. Petaluma’s vacancy remainsamong the highest in the county at 32.4%.Industrial vacancy remains on a healthy path, with Q3 2009ending at 13.9%, up 270 basis points since Q3 2008. Theaverage asking rate closed Q3 2009 at $8.25/SF gross peryear, down $0.24 SF from a year ago. Year-to-date 2009,Sonoma County has recorded about 610,000 SF of leasedspace. The industrial market has seen a slowdown in itsabsorption, although the food industry is taking advantageof this downturn by picking up large blocks of this space.<strong>Commercial</strong> sale activity has come to a stalemate during2009. Tenants and buyers are aggressively looking to takeadvantage of today’s soft market conditions, although at alevel that is sometimes more aggressive than landlords andsellers are able or willing to consider.We anticipate continued softening in values as capitalizationrates rise to accommodate perceived risk. Many are stillwaiting on the sidelines hesitant to commit due to currenteconomic conditions. There remains a large gap in perceivedvalues between owners and tenants/buyers.Contact<strong>NAI</strong> Capital (Ventura County)+1 805 278 1400<strong>NAI</strong> Capital (Westlake Village)+1 805 446 2400<strong>NAI</strong> Capital (Simi Valley)+1 805 522 7132Metropolitan AreaEconomic Overview2009Population2014 EstimatedPopulationEmploymentPopulationHouseholdAverage Income795,243857,787,305371,999$90,424Ventura County has certainly felt the impact of the recessionwith the demise of Countrywide, resulting in a negativeimpact on the office market. Vacancy rates are approaching20% and net absorption was negative through 2009 Q3.While this amounts to a substantial inventory, there is somegood news. Very little space is expected to return to themarket as it appears that Countrywide/Bank of America hasreturned the majority of its unused space. This will helpreduce vacancy rates for Class A space, the preferred spaceof Countywide.Demand for industrial space has slowed. A good deal ofthe decline is tied to the regional and national manufacturingsector and the Port of Hueneme. The port importsa significant number of the BMW automobiles that enter theWest Coast for US distribution. As demand for cars dwindled,so did the demand for industrial space related to warehousingand transporting. As it appears that world trade has begunto increase, it is likely that demand for industrial spacein Ventura County will also increase during the next 12months.The retail market also experienced contraction during therecession but seems to be improving. Rents have leveledoff and do not appear to be declining. In the WestlakeVillage/Thousand Oaks market, many centers have avacancy factor of less than 4%. The number of delinquenttenants has also dropped significantly and most retailersare reporting that sales activity is improving. One potentialproblem is a proposal by the City of Ventura to raise thesales taxes. If this ballot initiative passes, retail sales arelikely to fall across the board. This could have a negativeimpact on the demand for retail space.Tight credit conditions, increasing commercial default rates,and declining lease rates are negatively impacting the abilityof buyers to secure financing. As a result, the numberand dollar value of sales transactions is down considerably.However, low prices mean it is a good time to buy for thosewith adequate financing.MedianHousehold Income$67,472MedianHousehold Income$75,440Total PopulationMedian Age40.3Total PopulationMedian Age36.1Sonoma County At A Glance(Rent/SF/YR) Low High Effective Avg. VacancyDOWNTOWN OFFICENew Construction (AAA)Class A (Prime)Class B (Secondary)SUBURBAN OFFICENew Construction (AAA)Class A (Prime)Class B (Secondary)INDUSTRIAL$$N/AN/AN/AN/A16.2016.20$$N/AN/AN/AN/A30.0030.00N/AN/AN/AN/A$ 21.96$ 18.84N/AN/AN/AN/A34.6%20.2%Bulk WarehouseManufacturingHigh Tech/R&DRETAILDowntown$$4.564.56N/AN/A$$12.0012.00N/AN/A$$8.288.28N/AN/A13.9%13.9%N/AN/ANeighborhood Service CentersCommunity Power CenterRegional Malls$$22.2015.00N/A$$$36.0042.0035.40$ 24.76$ 26.13$ 21.834.1%3.0%14.4%DEVELOPMENT LAND Low/Acre High/AcreOffice in CBDLand in Office Parks$N/A871,200.00N/A$ 1,306,800.00Land in Industrial Parks$ 435,600.00 $ 871,200.00Office/Industrial Land - Non-parkRetail/<strong>Commercial</strong> Land$$653,400.00871,200.00$ 1,089,000.00$ 1,306,800.00Residential$ 2,718,000.00 $ 2,613,600.00Ventura County At A Glance(Rent/SF/YR) Low High Effective Avg. VacancyDOWNTOWN OFFICENew Construction (AAA)Class A (Prime)Class B (Secondary)SUBURBAN OFFICENew Construction (AAA)Class A (Prime)Class B (Secondary)INDUSTRIALBulk WarehouseManufacturingHigh Tech/R&DRETAILDowntownNeighborhood Service CentersCommunity Power CenterRegional Malls$$$$$$$$$N/AN/AN/A27.0027.0021.004.204.806.00N/A6.6013.4517.00$$$$$$$$$N/AN/AN/A35.0035.0026.4010.807.8015.00N/A39.0034.0048.00$$$$$$$$$N/AN/AN/A30.0030.0024.0015.0012.6010.50N/A25.7023.6321.17N/AN/AN/A78.8%19.6%16.7%5.9%6.3%7.0%N/A9.1%5.4%2.3%DEVELOPMENT LAND Low/Acre High/AcreOffice in CBDLand in Office ParksLand in Industrial ParksOffice/Industrial Land - Non-parkRetail/<strong>Commercial</strong> LandResidential$$$N/A430,500.00350,000.00N/A525,000.00N/A$$$N/A1,300,000.00875,000.00N/A1,300,000.00N/A<strong>2010</strong> <strong>Global</strong> <strong>Market</strong> <strong>Report</strong> ■ www.naiglobal.com 80
- Page 1 and 2:
CommercialCommercial Real Estate Se
- Page 3 and 4:
■ ■ ■ Table of ContentsGENERA
- Page 5 and 6:
Global OutlookCommercial real estat
- Page 7 and 8:
38.3% in November 2009. At the same
- Page 9 and 10:
quality than the Census properties.
- Page 11 and 12:
SaskatchewanSaskatchewan is a small
- Page 13 and 14:
As 2009 draws to a close, there is
- Page 15 and 16:
Global investment interest largely
- Page 18 and 19:
ChinaChina continued to post large
- Page 20 and 21:
MalaysiaWith Malaysia’s dependenc
- Page 22 and 23:
■ US Highlights - Northeast Regio
- Page 24 and 25:
■ US Highlights - Midwest Region
- Page 26 and 27:
■ US Highlights - West Region■
- Page 28 and 29:
Melbourne, AustraliaBeijing, ChinaC
- Page 30 and 31: Shanghai, ChinaXiamen, ChinaContact
- Page 32 and 33: Delhi, Gurgaon, IndiaHyderabad, Pra
- Page 34 and 35: Punjab, IndiaTokyo, JapanContactNAI
- Page 36 and 37: Seoul, South KoreaTaipei, TaiwanCon
- Page 38 and 39: Calgary, Alberta, CanadaEdmonton, A
- Page 40 and 41: Halifax, Nova Scotia, CanadaOttawa,
- Page 42 and 43: Regina, Saskatchewan, CanadaContact
- Page 44 and 45: Vienna, AustriaThe Baltics (Latvia/
- Page 46 and 47: Copenhagen, DenmarkFinlandContactNA
- Page 48 and 49: Athens, GreeceReykjavik IcelandCont
- Page 50 and 51: KuwaitOslo, NorwayContactNAI Kuwait
- Page 52 and 53: Moscow, Russian FederationSt. Peter
- Page 54 and 55: Madrid, SpainStockholm, SwedenConta
- Page 56 and 57: Istanbul, TurkeyKiev, UkraineContac
- Page 58 and 59: Latin AmericaSECTION CONTENTSBuenos
- Page 60 and 61: Campinas, BrazilCuritiba, BrazilCon
- Page 62 and 63: Sao Paulo, BrazilSantiago, ChileCon
- Page 64 and 65: Ciudad Juarez, Chihuahua, MexicoGua
- Page 66 and 67: Matamoros, Tamaulipas, MexicoMexica
- Page 68 and 69: Reynosa, MexicoSaltillo, Coahuila,
- Page 70 and 71: Torreon, Coahulia, MexicoCaracas, V
- Page 72 and 73: Birmingham, AlabamaHuntsville, Deca
- Page 74 and 75: Jonesboro, ArkansasLittle Rock, Ark
- Page 76 and 77: Marin County, CaliforniaMonterey, C
- Page 78 and 79: Sacramento, CaliforniaSan Diego, Ca
- Page 82 and 83: Colorado Springs, ColoradoDenver, C
- Page 84 and 85: Fort Lauderdale, FloridaFt. Myers/N
- Page 86 and 87: Miami, FloridaOrlando, FloridaConta
- Page 88 and 89: Atlanta, GeorgiaHonolulu, HawaiiCon
- Page 90 and 91: Chicago, IllinoisSpringfield, Illin
- Page 92 and 93: Cedar Rapids, Iowa City, IowaDavenp
- Page 94 and 95: Wichita, KansasLexington, KentuckyC
- Page 96 and 97: Monroe, LouisianaNew Orleans, Louis
- Page 98 and 99: Suburban MarylandBoston, Massachuse
- Page 100 and 101: Grand Rapids, MichiganLansing, Mich
- Page 102 and 103: St. Louis, MissouriBozeman, Montana
- Page 104 and 105: Omaha, NebraskaLas Vegas, NevadaCon
- Page 106 and 107: Portsmouth, New HampshireAtlantic C
- Page 108 and 109: Ocean/Monmouth Counties (“Shore M
- Page 110 and 111: Las Cruces, New MexicoAlbany, New Y
- Page 112 and 113: Asheville, North CarolinaCharlotte,
- Page 114 and 115: Fargo, North DakotaAkron, OhioConta
- Page 116 and 117: Cleveland, OhioColumbus, OhioContac
- Page 118 and 119: Tulsa, OklahomaPortland, OregonCont
- Page 120 and 121: Bucks County, PennsylvaniaHarrisbur
- Page 122 and 123: Pittsburgh, PennsylvaniaSchuylkill
- Page 124 and 125: Greenville/Spartanburg/Anderson Cou
- Page 126 and 127: Knoxville, TennesseeMemphis, Tennes
- Page 128 and 129: Beaumont, TexasCorpus Christi, Texa
- Page 130 and 131:
Fort Worth, TexasHouston, TexasCont
- Page 132 and 133:
Texarkana (Bowie County, Texas/Mill
- Page 134 and 135:
Northern VirginiaSeattle/Puget Soun
- Page 136 and 137:
Madison, WisconsinMilwaukee, Wiscon
- Page 138 and 139:
Jackson Hole, WyomingContactNAI Jac
- Page 140:
Build on the power of our network.N