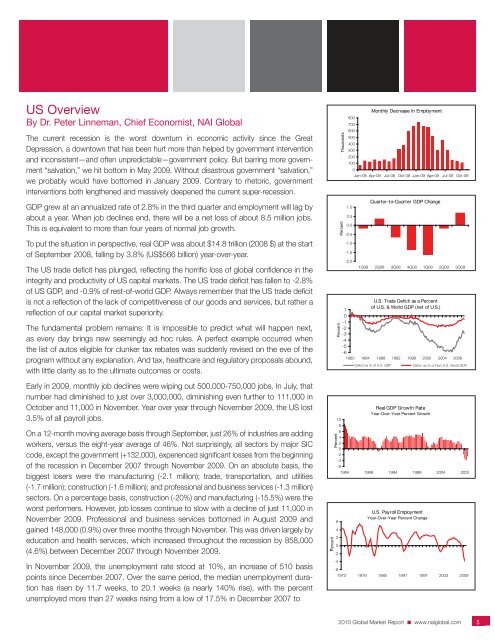
US OverviewBy Dr. Peter Linneman, Chief Economist, <strong>NAI</strong> <strong>Global</strong>The current recession is the worst downturn in economic activity since the GreatDepression, a downtown that has been hurt more than helped by government interventionand inconsistent—and often unpredictable—government policy. But barring more government“salvation,” we hit bottom in May 2009. Without disastrous government “salvation,”we probably would have bottomed in January 2009. Contrary to rhetoric, governmentinterventions both lengthened and massively deepened the current super-recession.GDP grew at an annualized rate of 2.8% in the third quarter and employment will lag byabout a year. When job declines end, there will be a net loss of about 8.5 million jobs.This is equivalent to more than four years of normal job growth.To put the situation in perspective, real GDP was about $14.8 trillion (2008 $) at the startof September 2008, falling by 3.8% (US$566 billion) year-over-year.The US trade deficit has plunged, reflecting the horrific loss of global confidence in theintegrity and productivity of US capital markets. The US trade deficit has fallen to -2.8%of US GDP, and -0.9% of rest-of-world GDP. Always remember that the US trade deficitis not a reflection of the lack of competitiveness of our goods and services, but rather areflection of our capital market superiority.The fundamental problem remains: It is impossible to predict what will happen next,as every day brings new seemingly ad hoc rules. A perfect example occurred whenthe list of autos eligible for clunker tax rebates was suddenly revised on the eve of theprogram without any explanation. And tax, healthcare and regulatory proposals abound,with little clarity as to the ultimate outcomes or costs.Early in 2009, monthly job declines were wiping out 500,000-750,000 jobs. In July, thatnumber had diminished to just over 3,000,000, diminishing even further to 111,000 inOctober and 11,000 in November. Year over year through November 2009, the US lost3.5% of all payroll jobs.On a 12-month moving average basis through September, just 26% of industries are addingworkers, versus the eight-year average of 46%. Not surprisingly, all sectors by major SICcode, except the government (+132,000), experienced significant losses from the beginningof the recession in December 2007 through November 2009. On an absolute basis, thebiggest losers were the manufacturing (-2.1 million); trade, transportation, and utilities(-1.7 million); construction (-1.6 million); and professional and business services (-1.3 million)sectors. On a percentage basis, construction (-20%) and manufacturing (-15.5%) were theworst performers. However, job losses continue to slow with a decline of just 11,000 inNovember 2009. Professional and business services bottomed in August 2009 andgained 148,000 (0.9%) over three months through November. This was driven largely byeducation and health services, which increased throughout the recession by 858,000(4.6%) between December 2007 through November 2009.<strong>Real</strong> GDP Growth RateYear-Over-Year Percent Growth1086420-2-4-61984 1989 1994 1999 2004 2009PercentIn November 2009, the unemployment rate stood at 10%, an increase of 510 basispoints since December 2007. Over the same period, the median unemployment durationhas risen by 11.7 weeks, to 20.1 weeks (a nearly 140% rise), with the percentunemployed more than 27 weeks rising from a low of 17.5% in December 2007 to<strong>2010</strong> <strong>Global</strong> <strong>Market</strong> <strong>Report</strong> ■ www.naiglobal.com5
38.3% in November 2009. At the same time, short-term (five weeks or less) unemploymentspells are back to the same level (1.8%) as December 2007, after peaking at 2.4%in January 2009. The truth is that many more people are unemployed, and for longer,as a result of rule-destroying government interventions, though modest improvementsare emerging.Teen workers accounted for about 19% of the 7.2 million jobs lost between January2008 and November 2009. Thank you, Congress, for the minimum wage increase. Joblosses continue to be extraordinarily male-centric, with 4.75 million of the 7.2 million totallost jobs concentrated among males older than 19, and only 1.69 million among womenolder than 19. This reflects the high concentration of males in manufacturing, constructionand finance, while women are disproportionately employed in the less adverselyimpacted healthcare and education sectors. As a result, females now hold half of all USjobs for the first time in US history.Percent403530252015105Manufacturing as a % of Total Employment(with trendline)01940 1950 1960 1970 1980 1990 2000The biggest uncertainty is not the capital markets; it is the Capitol markets. Despite theserial ineffectiveness of government interventions, investors are slowly coming out of theirtortoise shells. The early signs of recovery are fragile because of the surge in oil pricesback to $70 per barrel. At $70 per barrel, it will take much longer to rebuild consumer confidence,a precursor for a recovery. GDP bottomed in the third quarter, and employmentwill lag by about a year.In early December 2009, yields on 10-year Treasuries were around 3.5%. We believe 10-year Treasury yields are still some 125 basis points too low. If all were normal, 10-yearTreasury yields would be around 4.75-5%, where they hovered before October 2007.Recently, LIBOR and 30-day Treasuries have raced to zero. A low LIBOR has becomethe life blood for many borrowers with floating rate debt, and a rate spike has the potentialto crush many borrowers. Long-term Treasury Inflated-Protected Securities (TIPS)returns have narrowed remarkably, even as inflationary threats loom. They experienceda yield increase to 3.09% in November 2008, and stood at 1.87% in November 2009.Residential mortgage delinquencies have risen among all products since hitting lows inlate 2005. However, these delinquencies are highly concentrated in recession torngreater-Ohio (Ohio plus 100 miles beyond the Ohio border) and the boom markets ofsouth/central Florida, Arizona, Nevada and California. Elsewhere in the US, delinquenciesremain at cyclical norms.<strong>Commercial</strong> mortgage delinquency rates have risen across the board, most visibly atbanks and thrifts, and CMBS. CMBS issuance in the US remains nearly comatose, withno new issues in eight out of the first 10 months of the year. The only positive glimmerwas that the CMBS market managed to eke out a handful of deals in June (US$600million) and July 2009 (US$300 million). And the recent DDR issuance is decidedly apositive sign.The best news for the US economy continues to be that the US. housing market bottomedin February 2009. Single family starts hit (a very low) bottom of roughly 355,000units in January and February, increasing unsteadily to 511,000 in September and476,000 in October. The inventory of homes held by builders for sale has plummeted to239,000, as new home production over the past two years has been insufficient toreplace the more than 350,000 units destroyed each year. MLS home prices (whichIndex ValueU.S. National Home Price Indices3002602201801401001989 1992 1995 1998 2001 2004 2007Case-Shiller NAR FHFA<strong>2010</strong> <strong>Global</strong> <strong>Market</strong> <strong>Report</strong> ■ www.naiglobal.com6
- Page 1 and 2: CommercialCommercial Real Estate Se
- Page 3 and 4: ■ ■ ■ Table of ContentsGENERA
- Page 5: Global OutlookCommercial real estat
- Page 9 and 10: quality than the Census properties.
- Page 11 and 12: SaskatchewanSaskatchewan is a small
- Page 13 and 14: As 2009 draws to a close, there is
- Page 15 and 16: Global investment interest largely
- Page 18 and 19: ChinaChina continued to post large
- Page 20 and 21: MalaysiaWith Malaysia’s dependenc
- Page 22 and 23: ■ US Highlights - Northeast Regio
- Page 24 and 25: ■ US Highlights - Midwest Region
- Page 26 and 27: ■ US Highlights - West Region■
- Page 28 and 29: Melbourne, AustraliaBeijing, ChinaC
- Page 30 and 31: Shanghai, ChinaXiamen, ChinaContact
- Page 32 and 33: Delhi, Gurgaon, IndiaHyderabad, Pra
- Page 34 and 35: Punjab, IndiaTokyo, JapanContactNAI
- Page 36 and 37: Seoul, South KoreaTaipei, TaiwanCon
- Page 38 and 39: Calgary, Alberta, CanadaEdmonton, A
- Page 40 and 41: Halifax, Nova Scotia, CanadaOttawa,
- Page 42 and 43: Regina, Saskatchewan, CanadaContact
- Page 44 and 45: Vienna, AustriaThe Baltics (Latvia/
- Page 46 and 47: Copenhagen, DenmarkFinlandContactNA
- Page 48 and 49: Athens, GreeceReykjavik IcelandCont
- Page 50 and 51: KuwaitOslo, NorwayContactNAI Kuwait
- Page 52 and 53: Moscow, Russian FederationSt. Peter
- Page 54 and 55: Madrid, SpainStockholm, SwedenConta
- Page 56 and 57:
Istanbul, TurkeyKiev, UkraineContac
- Page 58 and 59:
Latin AmericaSECTION CONTENTSBuenos
- Page 60 and 61:
Campinas, BrazilCuritiba, BrazilCon
- Page 62 and 63:
Sao Paulo, BrazilSantiago, ChileCon
- Page 64 and 65:
Ciudad Juarez, Chihuahua, MexicoGua
- Page 66 and 67:
Matamoros, Tamaulipas, MexicoMexica
- Page 68 and 69:
Reynosa, MexicoSaltillo, Coahuila,
- Page 70 and 71:
Torreon, Coahulia, MexicoCaracas, V
- Page 72 and 73:
Birmingham, AlabamaHuntsville, Deca
- Page 74 and 75:
Jonesboro, ArkansasLittle Rock, Ark
- Page 76 and 77:
Marin County, CaliforniaMonterey, C
- Page 78 and 79:
Sacramento, CaliforniaSan Diego, Ca
- Page 80 and 81:
Santa Clara County (Silicon Valley)
- Page 82 and 83:
Colorado Springs, ColoradoDenver, C
- Page 84 and 85:
Fort Lauderdale, FloridaFt. Myers/N
- Page 86 and 87:
Miami, FloridaOrlando, FloridaConta
- Page 88 and 89:
Atlanta, GeorgiaHonolulu, HawaiiCon
- Page 90 and 91:
Chicago, IllinoisSpringfield, Illin
- Page 92 and 93:
Cedar Rapids, Iowa City, IowaDavenp
- Page 94 and 95:
Wichita, KansasLexington, KentuckyC
- Page 96 and 97:
Monroe, LouisianaNew Orleans, Louis
- Page 98 and 99:
Suburban MarylandBoston, Massachuse
- Page 100 and 101:
Grand Rapids, MichiganLansing, Mich
- Page 102 and 103:
St. Louis, MissouriBozeman, Montana
- Page 104 and 105:
Omaha, NebraskaLas Vegas, NevadaCon
- Page 106 and 107:
Portsmouth, New HampshireAtlantic C
- Page 108 and 109:
Ocean/Monmouth Counties (“Shore M
- Page 110 and 111:
Las Cruces, New MexicoAlbany, New Y
- Page 112 and 113:
Asheville, North CarolinaCharlotte,
- Page 114 and 115:
Fargo, North DakotaAkron, OhioConta
- Page 116 and 117:
Cleveland, OhioColumbus, OhioContac
- Page 118 and 119:
Tulsa, OklahomaPortland, OregonCont
- Page 120 and 121:
Bucks County, PennsylvaniaHarrisbur
- Page 122 and 123:
Pittsburgh, PennsylvaniaSchuylkill
- Page 124 and 125:
Greenville/Spartanburg/Anderson Cou
- Page 126 and 127:
Knoxville, TennesseeMemphis, Tennes
- Page 128 and 129:
Beaumont, TexasCorpus Christi, Texa
- Page 130 and 131:
Fort Worth, TexasHouston, TexasCont
- Page 132 and 133:
Texarkana (Bowie County, Texas/Mill
- Page 134 and 135:
Northern VirginiaSeattle/Puget Soun
- Page 136 and 137:
Madison, WisconsinMilwaukee, Wiscon
- Page 138 and 139:
Jackson Hole, WyomingContactNAI Jac
- Page 140:
Build on the power of our network.N