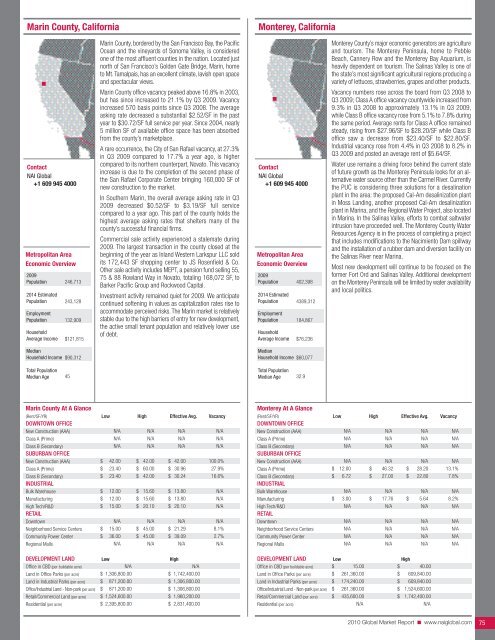
Marin County, CaliforniaMonterey, CaliforniaContact<strong>NAI</strong> <strong>Global</strong>+1 609 945 4000Metropolitan AreaEconomic Overview2009Population2014 EstimatedPopulationEmploymentPopulationHouseholdAverage Income246,713243,128132,909$121,815Marin County, bordered by the San Francisco Bay, the PacificOcean and the vineyards of Sonoma Valley, is consideredone of the most affluent counties in the nation. Located justnorth of San Francisco’s Golden Gate Bridge, Marin, hometo Mt. Tamalpais, has an excellent climate, lavish open spaceand spectacular views.Marin County office vacancy peaked above 16.8% in 2003,but has since increased to 21.1% by Q3 2009. Vacancyincreased 570 basis points since Q3 2008. The averageasking rate decreased a substantial $2.52/SF in the pastyear to $30.72/SF full service per year. Since 2004, nearly5 million SF of available office space has been absorbedfrom the county’s marketplace.A rare occurrence, the City of San Rafael vacancy, at 27.3%in Q3 2009 compared to 17.7% a year ago, is highercompared to its northern counterpart, Novato. This vacancyincrease is due to the completion of the second phase ofthe San Rafael Corporate Center bringing 160,000 SF ofnew construction to the market.In Southern Marin, the overall average asking rate in Q32009 decreased $0.52/SF to $3.19/SF full servicecompared to a year ago. This part of the county holds thehighest average asking rates that shelters many of thecounty’s successful financial firms.<strong>Commercial</strong> sale activity experienced a stalemate during2009. The largest transaction in the county closed at thebeginning of the year as Inland Western Larkspur LLC soldits 172,443 SF shopping center to JS Rosenfield & Co.Other sale activity includes MEPT, a pension fund selling 55,75 & 88 Rowland Way in Novato, totaling 168,072 SF, toBarker Pacific Group and Rockwood Capital.Investment activity remained quiet for 2009. We anticipatecontinued softening in values as capitalization rates rise toaccommodate perceived risks. The Marin market is relativelystable due to the high barriers of entry for new development,the active small tenant population and relatively lower useof debt.Contact<strong>NAI</strong> <strong>Global</strong>+1 609 945 4000Metropolitan AreaEconomic Overview2009Population2014 EstimatedPopulationEmploymentPopulationHouseholdAverage Income402,3984389,312184,867$76,236Monterey County’s major economic generators are agricultureand tourism. The Monterey Peninsula, home to PebbleBeach, Cannery Row and the Monterey Bay Aquarium, isheavily dependent on tourism. The Salinas Valley is one ofthe state’s most significant agricultural regions producing avariety of lettuces, strawberries, grapes and other products.Vacancy numbers rose across the board from Q3 2008 toQ3 2009; Class A office vacancy countywide increased from9.3% in Q3 2008 to approximately 13.1% in Q3 2009,while Class B office vacancy rose from 5.1% to 7.8% duringthe same period. Average rents for Class A office remainedsteady, rising from $27.96/SF to $28.20/SF while Class Boffice saw a decrease from $23.40/SF to $22.80/SF.Industrial vacancy rose from 4.4% in Q3 2008 to 8.2% inQ3 2009 and posted an average rent of $5.64/SF.Water use remains a driving force behind the current stateof future growth as the Monterey Peninsula looks for an alternativewater source other than the Carmel River. Currentlythe PUC is considering three solutions for a desalinationplant in the area: the proposed Cal-Am desalinization plantin Moss Landing, another proposed Cal-Am desalinizationplant in Marina, and the Regional Water Project, also locatedin Marina. In the Salinas Valley, efforts to combat saltwaterintrusion have proceeded well. The Monterey County WaterResources Agency is in the process of completing a projectthat includes modifications to the Nacimiento Dam spillwayand the installation of a rubber dam and diversion facility onthe Salinas River near Marina.Most new development will continue to be focused on theformer Fort Ord and Salinas Valley. Additional developmenton the Monterey Peninsula will be limited by water availabilityand local politics.MedianHousehold Income$90,312MedianHousehold Income$60,077Total PopulationMedian Age45Total PopulationMedian Age32.9Marin County At A Glance(Rent/SF/YR) Low High Effective Avg. VacancyDOWNTOWN OFFICENew Construction (AAA)Class A (Prime)Class B (Secondary)SUBURBAN OFFICENew Construction (AAA)Class A (Prime)Class B (Secondary)INDUSTRIALBulk WarehouseManufacturingHigh Tech/R&DRETAILDowntownNeighborhood Service CentersCommunity Power CenterRegional Malls$$$$$$$$N/AN/AN/A42.0023.4023.4012.0012.0015.00N/A15.0036.00N/A$$$$$$$$N/AN/AN/A42.0060.0042.0015.6015.6020.10N/A45.0045.00N/AN/AN/AN/A$ 42.00$ 30.96$ 30.24$ 13.80$ 13.80$ 20.10N/A$ 21.29$ 39.09N/AN/AN/AN/A100.0%27.9%16.6%N/AN/AN/AN/A8.1%2.7%N/ADEVELOPMENT LAND Low HighOffice in CBD (per buildable acre)Land in Office Parks (per acre)N/A$ 1,306,800.00N/A$ 1,742,400.00Land in Industrial Parks (per acre)Office/Industrial Land - Non-park (per acre)$$871,200.00871,200.00$ 1,306,800.00$ 1,306,800.00Retail/<strong>Commercial</strong> Land (per acre)Residential (per acre)$ 1,524,600.00$ 2,395,800.00$ 1,960,200.00$ 2,831,400.00Monterey At A Glance(Rent/SF/YR) Low High Effective Avg. VacancyDOWNTOWN OFFICENew Construction (AAA)Class A (Prime)Class B (Secondary)SUBURBAN OFFICENew Construction (AAA)Class A (Prime)Class B (Secondary)INDUSTRIALBulk WarehouseManufacturingHigh Tech/R&DRETAILDowntownNeighborhood Service CentersCommunity Power CenterRegional Malls$$$N/AN/AN/AN/A12.006.72N/A3.00N/AN/AN/AN/AN/A$$$N/AN/AN/AN/A46.3227.00N/A17.76N/AN/AN/AN/AN/A$$$N/AN/AN/AN/A28.2022.80N/A5.64N/AN/AN/AN/AN/AN/AN/AN/AN/A13.1%7.8%N/A8.2%N/AN/AN/AN/AN/ADEVELOPMENT LAND Low HighOffice in CBD (per buildable acre)Land in Office Parks (per acre)Land in Industrial Parks (per acre)Office/Industrial Land - Non-park (per acre)Retail/<strong>Commercial</strong> Land (per acre)Residential (per acre)$ 15.00 $ 40.00$ 261,360.00 $ 609,840.00$ 174,240.00 $ 609,840.00$ 261,360.00 $ 1,524,600.00$ 435,600.00 $ 1,742,400.00N/AN/A<strong>2010</strong> <strong>Global</strong> <strong>Market</strong> <strong>Report</strong> ■ www.naiglobal.com 75
Oakland, CaliforniaOrange County, CaliforniaContact<strong>NAI</strong> <strong>Global</strong>+1 609 945 4000Metropolitan AreaEconomic Overview2009Population2014 EstimatedPopulationEmploymentPopulationHouseholdAverage IncomeMedianHousehold IncomeTotal PopulationMedian Age4,249,6444,362,6442,274,988$100,489$77,44040The East Bay office market has risen to a 17.7% vacancy,a 3.2% increase since Q3 2008. Vacancy had steadilyremained around 14% since Q3 2005 until this year whenvacancy climbed each successive quarter to its current level.The average asking rate decreased $2.28 in the past yearto $25.92/SF per year for full-service properties.The “core” East Bay office market accounts for a total buildingbase of 21 million SF. Vacancy is at 14.3% and the averageasking rate is $27.12/SF per year for full-service properties.R&D vacancy continues to hover above 20%, climbing from20.6% in Q3 2008 to 23.1% in Q3 2009. The averageasking rate has dropped from $13.28/SF in Q3 2008 to$11.22/SF NNN. Year-to-date 2009, the R&D market hasrecorded over 3 million SF of gross absorption, an improvementover 2008, which totaled less than 3.5 million SF.Manufacturing vacancy closed Q3 2009 at 7.6%, up from5.2% in Q3 2008. The average asking rate fell from $6.83to $6.00/SF per year NNN during the same time span.Year-to-date 2009, the manufacturing market has amassedover 4.7 million SF in gross absorption, which is alreadygreater than 2008’s total gross absorption of 4.6 million SF.The retail shopping centers market ended mid-year 2009with vacancy climbing and asking rates steadily dropping.Vacancy was 7.2% on gross leasable area of 25 million SFwith the average asking rate $24.83/SF NNN.Investment activity has been steady through Q3 2009.HRPT properties secured the largest sale of 2009 with thepurchase of TMG/JER’s Bayside Business Park in Fremontwith the four-building portfolio measuring 392,488 SF ofR&D space.Many large construction projects have been put on holddue to the poor economic forecast. Earlier this year, EllisPartners completed their 110,000 SF office/retail buildingin Jack London Square; however, the building is currently100% vacant.Contact<strong>NAI</strong> Capital+1 949 854 6600Metropolitan AreaEconomic Overview2009Population2014 EstimatedPopulationEmploymentPopulationHouseholdAverage IncomeMedianHousehold IncomeTotal PopulationMedian Age2,985,4982,956,0481,413,475$98,346$75,63836.5The Orange County office, retail and industrial markets havebegun to recover from the last two years of economic slowdown. The Orange County market was particularly hardhit during the recession due to the downfall of the nationalsub-prime lenders headquartered in Orange County, theconstruction of 4 million SF of Class A office projects andunemployment rising from 3.5% to 9.5%.The good news is that the worst is likely over in OrangeCounty. Many existing companies are beginning to lockin long term leases at rates that are the lowest in 10 years.Conditions may deteriorate further but not to the extentwitnessed over the last 24 months. Although leasing activityhas been driven primarily by existing companies renewingtheir leases early, the Orange County market has beenone of the most active in the US, according to real estateinformation provided by CoStar. We are beginning to see amigration from low rise to Class A high rise space as tenantstake advantage of lower lease rates.Orange County retail markets have fared well. Vacancy rateshave crept above 5% while lease rates declined only 1%from last year. These trends may continue as consumerscontinue to cut spending in favor of savings. However, aweak dollar combined with economic growth in Asia, is likelyto boost tourism in Orange County. Increased tourism willhelp to offset weak domestic retail spending.The Orange County industrial market experienced a contractionduring the recession. Vacancy rates rose above 10% in two ofthe markets tracked. On average, lease rates declined 4.1%from Q3 2008 levels. Due to these conditions, constructionactivity came to a halt. While this is certainly a negative, it isthe first step for recovery in the market. At the moment, overallcapacity is capped at current levels.As economic conditions improve, low lease rates are likelyto entice new entrants into the market. With capacitycapped, vacancy rates will decline. Lease rates will increaseas the market eventually tightens.Oakland At A Glance(Rent/SF/YR) Low High Effective Avg. VacancyDOWNTOWN OFFICENew Construction (AAA)Class A (Prime)Class B (Secondary)SUBURBAN OFFICENew Construction (AAA)Class A (Prime)Class B (Secondary)INDUSTRIAL$$$$N/A12.0010.08N/A13.209.00$$$$N/A37.2034.32N/A30.0031.20N/A$ 29.90$ 25.01N/A$ 28.76$ 19.37N/A14.9%22.1%N/A14.1%24.4%Bulk WarehouseManufacturing$$1.802.40$$7.2012.00$$3.884.506.1%6.1%High Tech/R&DRETAILDowntownNeighborhood Service CentersCommunity Power CenterRegional Malls$$$3.60N/A6.006.00N/A$$$42.00N/A48.0048.00N/A$ 11.42N/A$ 24.83$ 24.83N/A23.1%N/A4.4%4.4%N/ADEVELOPMENT LAND Low/Acre High/AcreOffice in CBDLand in Office ParksLand in Industrial ParksOffice/Industrial Land - Non-parkRetail/<strong>Commercial</strong> LandResidentialN/AN/AN/AN/AN/AN/AN/AN/AN/AN/AN/AN/AOrange County At A Glance(Rent/SF/YR) Low High Effective Avg. VacancyDOWNTOWN OFFICENew Construction (AAA)Class A (Prime)Class B (Secondary)SUBURBAN OFFICENew Construction (AAA)Class A (Prime)Class B (Secondary)INDUSTRIALBulk WarehouseManufacturingHigh Tech/R&DRETAILDowntownNeighborhood Service CentersCommunity Power CenterRegional Malls$$$$$$$$$N/AN/AN/A23.159.008.523.002.403.00N/A10.2012.0018.61$$$$$$$$$N/AN/AN/A45.4060.0048.4022.8021.0022.80N/A60.0072.0051.00$$$$$$$$$N/AN/AN/A37.4828.9424.397.927.337.63N/A24.9325.1526.11N/AN/AN/A11.7%21.2%17.5%8.6%11.0%10.1%N/A6.0%5.0%3.6%DEVELOPMENT LAND Low/Acre High/AcreOffice in CBDLand in Office Parks)Land in Industrial ParksOffice/Industrial Land - Non-parkRetail/<strong>Commercial</strong> LandResidential$$$N/A1,392,857.001,286,434.00N/A1,200,000.00N/A$$$N/A2,333,333.002,000,000.00N/A3,076,923.00N/A<strong>2010</strong> <strong>Global</strong> <strong>Market</strong> <strong>Report</strong> ■ www.naiglobal.com 76
- Page 1 and 2:
CommercialCommercial Real Estate Se
- Page 3 and 4:
■ ■ ■ Table of ContentsGENERA
- Page 5 and 6:
Global OutlookCommercial real estat
- Page 7 and 8:
38.3% in November 2009. At the same
- Page 9 and 10:
quality than the Census properties.
- Page 11 and 12:
SaskatchewanSaskatchewan is a small
- Page 13 and 14:
As 2009 draws to a close, there is
- Page 15 and 16:
Global investment interest largely
- Page 18 and 19:
ChinaChina continued to post large
- Page 20 and 21:
MalaysiaWith Malaysia’s dependenc
- Page 22 and 23:
■ US Highlights - Northeast Regio
- Page 24 and 25:
■ US Highlights - Midwest Region
- Page 26 and 27: ■ US Highlights - West Region■
- Page 28 and 29: Melbourne, AustraliaBeijing, ChinaC
- Page 30 and 31: Shanghai, ChinaXiamen, ChinaContact
- Page 32 and 33: Delhi, Gurgaon, IndiaHyderabad, Pra
- Page 34 and 35: Punjab, IndiaTokyo, JapanContactNAI
- Page 36 and 37: Seoul, South KoreaTaipei, TaiwanCon
- Page 38 and 39: Calgary, Alberta, CanadaEdmonton, A
- Page 40 and 41: Halifax, Nova Scotia, CanadaOttawa,
- Page 42 and 43: Regina, Saskatchewan, CanadaContact
- Page 44 and 45: Vienna, AustriaThe Baltics (Latvia/
- Page 46 and 47: Copenhagen, DenmarkFinlandContactNA
- Page 48 and 49: Athens, GreeceReykjavik IcelandCont
- Page 50 and 51: KuwaitOslo, NorwayContactNAI Kuwait
- Page 52 and 53: Moscow, Russian FederationSt. Peter
- Page 54 and 55: Madrid, SpainStockholm, SwedenConta
- Page 56 and 57: Istanbul, TurkeyKiev, UkraineContac
- Page 58 and 59: Latin AmericaSECTION CONTENTSBuenos
- Page 60 and 61: Campinas, BrazilCuritiba, BrazilCon
- Page 62 and 63: Sao Paulo, BrazilSantiago, ChileCon
- Page 64 and 65: Ciudad Juarez, Chihuahua, MexicoGua
- Page 66 and 67: Matamoros, Tamaulipas, MexicoMexica
- Page 68 and 69: Reynosa, MexicoSaltillo, Coahuila,
- Page 70 and 71: Torreon, Coahulia, MexicoCaracas, V
- Page 72 and 73: Birmingham, AlabamaHuntsville, Deca
- Page 74 and 75: Jonesboro, ArkansasLittle Rock, Ark
- Page 78 and 79: Sacramento, CaliforniaSan Diego, Ca
- Page 80 and 81: Santa Clara County (Silicon Valley)
- Page 82 and 83: Colorado Springs, ColoradoDenver, C
- Page 84 and 85: Fort Lauderdale, FloridaFt. Myers/N
- Page 86 and 87: Miami, FloridaOrlando, FloridaConta
- Page 88 and 89: Atlanta, GeorgiaHonolulu, HawaiiCon
- Page 90 and 91: Chicago, IllinoisSpringfield, Illin
- Page 92 and 93: Cedar Rapids, Iowa City, IowaDavenp
- Page 94 and 95: Wichita, KansasLexington, KentuckyC
- Page 96 and 97: Monroe, LouisianaNew Orleans, Louis
- Page 98 and 99: Suburban MarylandBoston, Massachuse
- Page 100 and 101: Grand Rapids, MichiganLansing, Mich
- Page 102 and 103: St. Louis, MissouriBozeman, Montana
- Page 104 and 105: Omaha, NebraskaLas Vegas, NevadaCon
- Page 106 and 107: Portsmouth, New HampshireAtlantic C
- Page 108 and 109: Ocean/Monmouth Counties (“Shore M
- Page 110 and 111: Las Cruces, New MexicoAlbany, New Y
- Page 112 and 113: Asheville, North CarolinaCharlotte,
- Page 114 and 115: Fargo, North DakotaAkron, OhioConta
- Page 116 and 117: Cleveland, OhioColumbus, OhioContac
- Page 118 and 119: Tulsa, OklahomaPortland, OregonCont
- Page 120 and 121: Bucks County, PennsylvaniaHarrisbur
- Page 122 and 123: Pittsburgh, PennsylvaniaSchuylkill
- Page 124 and 125: Greenville/Spartanburg/Anderson Cou
- Page 126 and 127:
Knoxville, TennesseeMemphis, Tennes
- Page 128 and 129:
Beaumont, TexasCorpus Christi, Texa
- Page 130 and 131:
Fort Worth, TexasHouston, TexasCont
- Page 132 and 133:
Texarkana (Bowie County, Texas/Mill
- Page 134 and 135:
Northern VirginiaSeattle/Puget Soun
- Page 136 and 137:
Madison, WisconsinMilwaukee, Wiscon
- Page 138 and 139:
Jackson Hole, WyomingContactNAI Jac
- Page 140:
Build on the power of our network.N


