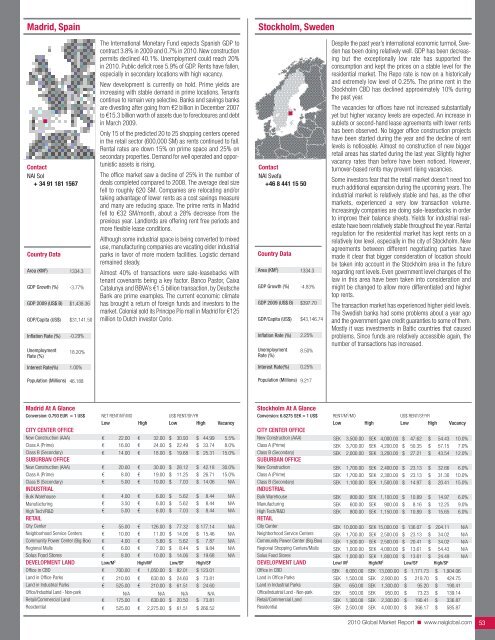
Madrid, SpainStockholm, SwedenContact<strong>NAI</strong> Sol+ 34 91 181 1567Country DataArea (KM 2 )GDP Growth (%)GDP 2009 (US$ B)GDP/Capita (US$)Inflation Rate (%)UnemploymentRate (%)1334.3-3.77%$1,438.36$31,141.50-0.29%18.20%The International Monetary Fund expects Spanish GDP tocontract 3.8% in 2009 and 0.7% in <strong>2010</strong>. New constructionpermits declined 40.1%. Unemployment could reach 20%in <strong>2010</strong>. Public deficit rose 5.9% of GDP. Rents have fallen,especially in secondary locations with high vacancy.New development is currently on hold. Prime yields areincreasing with stable demand in prime locations. Tenantscontinue to remain very selective. Banks and savings banksare divesting after going from €2 billion in December 2007to €15.3 billion worth of assets due to foreclosures and debtin March 2009.Only 15 of the predicted 20 to 25 shopping centers openedin the retail sector (600,000 SM) as rents continued to fall.Rental rates are down 15% on prime space and 25% onsecondary properties. Demand for well operated and opportunisticassets is rising.The office market saw a decline of 25% in the number ofdeals completed compared to 2008. The average deal sizefell to roughly 620 SM. Companies are relocating and/ortaking advantage of lower rents as a cost savings measureand many are reducing space. The prime rents in Madridfell to €32 SM/month, about a 28% decrease from theprevious year. Landlords are offering rent free periods andmore flexible lease conditions.Although some industrial space is being converted to mixeduse, manufacturing companies are vacating older industrialparks in favor of more modern facilities. Logistic demandremained steady.Almost 40% of transactions were sale-leasebacks withtenant covenants being a key factor. Banco Pastor, CaixaCatalunya and BBVA’s €1.5 billion transaction, by DeutscheBank are prime examples. The current economic climatehas brought a return of foreign funds and investors to themarket. Colonial sold its Principe Pío mall in Madrid for €125million to Dutch investor Corio.Contact<strong>NAI</strong> Svefa+46 8 441 15 50Country DataArea (KM 2 )GDP Growth (%)GDP 2009 (US$ B)GDP/Capita (US$)Inflation Rate (%)UnemploymentRate (%)1334.3-4.83%$397.70$43,146.742.25%8.50%Despite the past year’s international economic turmoil, Swedenhas been doing relatively well. GDP has been decreasingbut the exceptionally low rate has supported theconsumption and kept the prices on a stable level for theresidential market. The Repo rate is now on a historicallyand extremely low level of 0.25%. The prime rent in theStockholm CBD has declined approximately 10% duringthe past year.The vacancies for offices have not increased substantiallyyet but higher vacancy levels are expected. An increase insublets or second-hand lease agreements with lower rentshas been observed. No bigger office construction projectshave been started during the year and the decline of rentlevels is noticeable. Almost no construction of new biggerretail areas has started during the last year. Slightly highervacancy rates than before have been noticed. However,turnover-based rents may prevent rising vacancies.Some investors fear that the retail market doesn’t need toomuch additional expansion during the upcoming years. Theindustrial market is relatively stable and has, as the othermarkets, experienced a very low transaction volume.Increasingly companies are doing sale-leasebacks in orderto improve their balance sheets. Yields for industrial realestatehave been relatively stable throughout the year. Rentalregulation for the residential market has kept rents on arelatively low level, especially in the city of Stockholm. Newagreements between different negotiating parties havemade it clear that bigger consideration of location shouldbe taken into account in the Stockholm area in the futureregarding rent levels. Even government level changes of thelaw in this area have been taken into consideration andmight be changed to allow more differentiated and highertop rents.The transaction market has experienced higher yield levels.The Swedish banks had some problems about a year agoand the government gave credit guaranties to some of them.Mostly it was investments in Baltic countries that causedproblems. Since funds are relatively accessible again, thenumber of transactions has increased.Interest Rate(%)1.00%Interest Rate(%)0.25%Population (Millions) 46.188Population (Millions)9.217Madrid At A GlanceConversion: 0.793 EUR = 1 US$ NET RENT/M 2 /MO US$ RENT/SF/YRLow High Low High VacancyCITY CENTER OFFICENew Construction (AAA)Class A (Prime)Class B (Secondary)SUBURBAN OFFICENew Construction (AAA)Class A (Prime)Class B (Secondary)INDUSTRIALBulk WarehouseManufacturingHigh Tech/R&DRETAIL€€€€€€€€€22.0016.0014.0020.008.005.004.003.505.00€€€€€€€€€32.0024.0018.0030.0019.0010.006.006.006.00$$$$$$$$$30.9322.4919.6828.1211.257.035.625.627.03$$$$$$$$$44.9933.7425.3142.1826.7114.068.448.448.445.5%8.0%15.0%30.0%15.0%N/AN/AN/AN/ACity Center€ 55.00 € 126.00 $ 77.32 $ 177.14 N/ANeighborhood Service CentersCommunity Power Center (Big Box)Regional MallsSolus Food Stores€€€€10.004.006.008.00€€€€11.005.607.0010.00$$$$14.065.628.4414.06$$$$15.467.879.8419.68N/AN/AN/AN/ADEVELOPMENT LAND Low/M 2 High/M 2 Low/SF High/SFOffice in CBDLand in Office ParksLand in Industrial ParksOffice/Industrial Land - Non-parkRetail/<strong>Commercial</strong> LandResidential€ 700.00 € 1,050.00 $ 82.01 $ 123.01€ 210.00 € 630.00 $ 24.60 $ 73.81€ 525.00 € 210.00 $ 61.51 $ 24.60N/A N/A N/A N/A€ 175.00 € 630.00 $ 20.50 $ 73.81€ 525.00 € 2,275.00 $ 61.51 $ 266.52Stockholm At A GlanceConversion: 6.8275 SEK = 1 US$ RENT/M 2 /MO US$ RENT/SF/YRLow High Low High VacancyCITY CENTER OFFICENew Construction (AAA)Class A (Prime)Class B (Secondary)SUBURBAN OFFICENew ConstructionClass A (Prime)Class B (Secondary)INDUSTRIALBulk WarehouseSEKSEKSEKSEKSEKSEKSEK3,500.003,700.002,000.001,700.001,700.001,100.00800.00SEK 4,000.00SEK 4,200.00SEK 3,200.00SEK 2,400.00SEK 2,300.00SEK 1,500.00SEK 1,100.00$$$$$$$47.6250.3527.2123.1323.1314.9710.89$$$$$$$54.4357.1543.5432.6631.3020.4114.9710.0%7.0%12.0%6.0%10.0%15.0%6.0%ManufacturingSEK 600.00 SEK 900.00 $ 8.16 $ 12.25 9.0%High Tech/R&DRETAILSEK 800.00 SEK 1,150.00 $ 10.89 $ 15.65 6.0%City CenterSEK 10,000.00 SEK 15,000.00 $ 136.07 $ 204.11 N/ANeighborhood Service CentersCommunity Power Center (Big Box)Regional Shopping Centers/MallsSolus Food StoresSEKSEKSEKSEK1,700.001,500.001,000.001,000.00SEK 2,500.00SEK 2,500.00SEK 4,000.00SEK 1,800.00$$$$23.1320.4113.6113.61$$$$34.0234.0254.4324.49N/AN/AN/AN/ADEVELOPMENT LAND Low/ M 2 High/M 2 Low/SF High/SFOffice in CBDLand in Office ParksLand in Industrial ParksOffice/Industrial Land - Non-parkRetail/<strong>Commercial</strong> LandResidentialSEK 8,000.00 SEK 13,000.00 $ 1,171.73 $ 1,904.06SEK 1,500.00 SEK 2,900.00 $ 219.70 $ 424.75SEK 650.00 SEK 1,300.00 $ 95.20 $ 190.41SEK 500.00 SEK 950.00 $ 73.23 $ 139.14SEK 1,300.00 SEK 2,300.00 $ 190.41 $ 336.87SEK 2,500.00 SEK 4,000.00 $ 366.17 $ 585.87<strong>2010</strong> <strong>Global</strong> <strong>Market</strong> <strong>Report</strong> ■ www.naiglobal.com 53
Geneva, SwitzerlandZürich, SwitzerlandContact<strong>NAI</strong> <strong>Commercial</strong> CRE+ 41 22 707 44 44Country DataArea (KM 2 )GDP Growth (%)GDP 2009 (US$ B)GDP/Capita (US$)Inflation Rate (%)UnemploymentRate (%)Interest Rate(%)1334.3-1.95%$484.13$66,126.80-0.40%3.48%0.25%Population (Millions) 7.321The Geneva area has weathered the economic storm relativelywell within the traditional sectors of finance and bio-pharma,although a greater impact has been apparent within thewatch making industry. Inflation has revolved around zerosince March 2009 and at the time of publication the averageinflation rate for 2009 is -0.5%. Unemployment rose during2009 to 3.9%, which remains low in European terms,though Geneva has suffered more than other zones in thisrespect.The office market has seen strong take-up in the CBD andairport areas. Waterfront premises remain in short supplywith tenants prepared to drive up rental values.The interest of hedge funds has been sustained throughout2009. Combined with the effect of the “winners and losers”among the private banks and financial sector in general, theGeneva area will see a rise in occupation by April <strong>2010</strong>, asthe financial players seek to position themselves.Prime rents remained buoyant in 2009, with waterfrontproperties renting for around CHF 1,000/SM per year andwell above for exceptional properties. The industrial markethas been more subdued throughout 2009 with many projectsput on hold or postponed. Despite this, developmentshave seen take-up from certain sectors such as bio-pharma,micro-technology and life science sectors. Rents remain atCHF 120-150/SM per year for production areas and CHF200-360/SM per year for high tech office space.The investment market for landmark buildings has remainedstrong with prime properties still commanding net yieldsbetween 3.25-3.85% as demand outstrips supply. The secondaryareas have seen a softening of yields and a reductionin the volume of sales.The retail market has been under pressure since September,suffering from an over-heated market during 2008 coupledwith the world economic downturn. Although still relativelyscarce, marketed units are reverting in line with sustainablemarket values.In general, prospects appear good for Geneva, which hassuffered less than many European neighbors, benefitingfrom its traditional “safe-haven” effect. While prime downtownareas will remain stable, a number of developmentson the outskirts of Geneva and around the airport may findtake-up slow in <strong>2010</strong>.Contact<strong>NAI</strong> <strong>Commercial</strong> CRE+ 41 44 221 04 04Country DataArea (KM 2 )GDP Growth (%)GDP 2009 (US$ B)GDP/Capita (US$)Inflation Rate (%)UnemploymentRate (%)Interest Rate(%)1334.3-1.95%$484.13$66,126.80-0.40%3.48%0.25%Population (Millions) 7.321The Greater Zürich Area (GZA) is known for the financial,insurance and industrial sectors together with growing IT,pharma and life-science industries. A gradual slowdown wasnoted in the economy in the first two quarters of 2009, howeversince June a positive change has been noted. ProjectedGDP figures for 2009 are estimated at -1.7% year over year.Compared with the GDP fall to -4.6% in the Eurozone,Switzerland appears fairly stable.Despite weak demand, office projects have proceeded in thefinancial, insurance and IT sectors as they benefit fromrealignment within the Zürich marketplace. Google, Microsoftand Red Herring have all announced new expansion plans.Other players include Draper Investment, Meltwater News andDiamond Systems. Allianz has announced the re-grouping ofits organization to Wallisellen (ZH) and New Reinsurance hasrelocated from Geneva to Zürich. ACM has also opened anew branch along Bahnhofstrasse.Zürich prime rents peaked in Q1, having reached a levelbetween CHF 850-900/SM per year. The industrial sectorhas been stagnant, with many decisions being postponedor cancelled. Rents remain stable, though take-up is slow.Foreign investment interest remains strong, although majorSwiss funds rapidly acquire suitable prime properties, whichare in short supply. Owner-occupation remains stable, withthe majority of the activity in the pharmaceutical, biotech,life science or financial sectors. The volume of sales remainslow; however, prime yields have barely softened with netyields continuing to perform at sub -4% for prime locations.Bahnhofstrasse added the new Apple store to its worldbrand, however with the exception of a few newcomers theretail sector has suffered from the sluggish economy. Rentsare in the order of CHF 3,500-3,800/SM per year, thoughsome deals have resulted in achieved rents in excess of CHF7,500/SM per year.Numerous commercial projects on the outskirts of the CBDmay prevent stagnation at a later date. However, qualityoffice accommodations with large floor plans have alreadysecured occupants, notably in the WestPark Areal and Ernst& Young set to occupy the Platform area of the Prime Towerdevelopment.Geneva At A GlanceConversion: 1.2237 CHF = 1 US$ RENT/M 2 /MO US$ RENT/SF/YRLow High Low High VacancyCITY CENTER OFFICENew Construction (AAA)CHF 900.00 CHF 1,200.00 $ 82.99 $ 110.66 1.0%Class A (Prime)CHF 850.00 CHF 1,000.00 $ 78.38 $ 92.21 1.0%Class B (Secondary)SUBURBAN OFFICENew Construction (AAA)Class A (Prime)Class B (Secondary)INDUSTRIALCHF 550.00CHF 450.00CHF 450.00CHF 300.00CHFCHFCHFCHF800.00600.00550.00450.00$ 50.72$ 41.50$ 41.50$ 27.66$$$$73.7755.3350.7241.505.0%2.5%3.5%5.0%Bulk WarehouseManufacturingCHFCHF70.0090.00CHFCHF90.00150.00$$6.468.30$$8.3013.831.0%1.0%High Tech/R&DRETAILCHF 250.00 CHF 360.00 $ 23.05 $ 33.20 2.0%City CenterCHF 3,250.00 CHF 4,500.00 $ 299.70 $ 414.96 1.0%Neighborhood Service CentersCommunity Power Center (Big Box)Regional Shopping Centers/MallsSolus Food StoresCHF 450.00N/ACHF 350.00N/ACHFCHF500.00N/A600.00N/A$ 41.50N/A$ 32.28N/A$$46.11N/A55.33N/A4.0%N/A1.5%N/ADEVELOPMENT LAND Low/M 2 High/M 2 Low/SF High/SFOffice in CBDLand in Office ParksLand in Industrial ParksOffice/Industrial Land - Non-parkRetail/<strong>Commercial</strong> LandResidentialCHF 30,000 CHF 40,000 $ 2,766.43 $ 3,688.57CHF 700 CHF 900 $ 64.55 $ 82.99CHF 200 CHF 300 $ 18.44 $ 27.66CHF 250 CHF 400 $ 23.05 $ 36.89CHF 1,000 CHF 1,500 $ 92.21 $ 138.32N/A N/A N/A N/AZürich At A GlanceConversion: 1.00746 CHF = 1 US$ RENT/M 2 /YR US$ RENT/SF/YRLow High Low High VacancyCITY CENTER OFFICENew Construction (AAA)CHF 800.00 CHF 1,000.00 $ 73.77 $ 92.21 1.0%Class A (Prime)Class B (Secondary)SUBURBAN OFFICECHF 750.00CHF 450.00CHFCHF900.00650.00$ 69.16$ 41.50$$82.9959.941.5%4.5%New Construction (AAA)Class A (Prime)Class B (Secondary)INDUSTRIALCHF 450.00CHF 300.00CHF 300.00CHF 550.00CHF 450.00CHF 450.00$ 41.50$ 27.66$ 27.66$$$50.7241.5041.504.0%4.5%6.0%Bulk WarehouseManufacturingCHF 70.00CHF 80.00CHFCHF90.00150.00$$6.467.38$$8.3013.831.0%1.0%High Tech/R&DRETAILCHF 200.00 CHF 380.00 $ 18.44 $ 35.04 2.5%City CenterCHF 3,500.00 CHF 5,000.00 $ 322.75 $ 461.07 1.0%Neighborhood Service CentersCommunity Power Center (Big Box)CHF 450.00N/ACHF 500.00N/A$ 41.50N/A$ 46.11N/A4.0%N/ARegional Shopping Centers/MallsSolus Food StoresCHF 450.00N/ACHF 800.00N/A$ 41.50N/A$ 73.77N/A2.0%N/ADEVELOPMENT LAND Low/M 2 High/M 2 Low/SF High/SFOffice in CBDLand in Office ParksLand in Industrial ParksOffice/Industrial Land - Non-parkRetail/<strong>Commercial</strong> LandResidentialCHF 30,000 CHF 40,000 $ 2,766.43 $ 3,688.57CHF 700 CHF 900 $ 64.55 $ 82.99CHF 250 CHF 350 $ 23.05 $ 32.28CHF 250 CHF 650 $ 23.05 $ 59.94CHF 1,000 CHF 1,600 $ 92.21 $ 147.54N/A N/A N/A N/A<strong>2010</strong> <strong>Global</strong> <strong>Market</strong> <strong>Report</strong> ■ www.naiglobal.com 54
- Page 1 and 2:
CommercialCommercial Real Estate Se
- Page 3 and 4: ■ ■ ■ Table of ContentsGENERA
- Page 5 and 6: Global OutlookCommercial real estat
- Page 7 and 8: 38.3% in November 2009. At the same
- Page 9 and 10: quality than the Census properties.
- Page 11 and 12: SaskatchewanSaskatchewan is a small
- Page 13 and 14: As 2009 draws to a close, there is
- Page 15 and 16: Global investment interest largely
- Page 18 and 19: ChinaChina continued to post large
- Page 20 and 21: MalaysiaWith Malaysia’s dependenc
- Page 22 and 23: ■ US Highlights - Northeast Regio
- Page 24 and 25: ■ US Highlights - Midwest Region
- Page 26 and 27: ■ US Highlights - West Region■
- Page 28 and 29: Melbourne, AustraliaBeijing, ChinaC
- Page 30 and 31: Shanghai, ChinaXiamen, ChinaContact
- Page 32 and 33: Delhi, Gurgaon, IndiaHyderabad, Pra
- Page 34 and 35: Punjab, IndiaTokyo, JapanContactNAI
- Page 36 and 37: Seoul, South KoreaTaipei, TaiwanCon
- Page 38 and 39: Calgary, Alberta, CanadaEdmonton, A
- Page 40 and 41: Halifax, Nova Scotia, CanadaOttawa,
- Page 42 and 43: Regina, Saskatchewan, CanadaContact
- Page 44 and 45: Vienna, AustriaThe Baltics (Latvia/
- Page 46 and 47: Copenhagen, DenmarkFinlandContactNA
- Page 48 and 49: Athens, GreeceReykjavik IcelandCont
- Page 50 and 51: KuwaitOslo, NorwayContactNAI Kuwait
- Page 52 and 53: Moscow, Russian FederationSt. Peter
- Page 56 and 57: Istanbul, TurkeyKiev, UkraineContac
- Page 58 and 59: Latin AmericaSECTION CONTENTSBuenos
- Page 60 and 61: Campinas, BrazilCuritiba, BrazilCon
- Page 62 and 63: Sao Paulo, BrazilSantiago, ChileCon
- Page 64 and 65: Ciudad Juarez, Chihuahua, MexicoGua
- Page 66 and 67: Matamoros, Tamaulipas, MexicoMexica
- Page 68 and 69: Reynosa, MexicoSaltillo, Coahuila,
- Page 70 and 71: Torreon, Coahulia, MexicoCaracas, V
- Page 72 and 73: Birmingham, AlabamaHuntsville, Deca
- Page 74 and 75: Jonesboro, ArkansasLittle Rock, Ark
- Page 76 and 77: Marin County, CaliforniaMonterey, C
- Page 78 and 79: Sacramento, CaliforniaSan Diego, Ca
- Page 80 and 81: Santa Clara County (Silicon Valley)
- Page 82 and 83: Colorado Springs, ColoradoDenver, C
- Page 84 and 85: Fort Lauderdale, FloridaFt. Myers/N
- Page 86 and 87: Miami, FloridaOrlando, FloridaConta
- Page 88 and 89: Atlanta, GeorgiaHonolulu, HawaiiCon
- Page 90 and 91: Chicago, IllinoisSpringfield, Illin
- Page 92 and 93: Cedar Rapids, Iowa City, IowaDavenp
- Page 94 and 95: Wichita, KansasLexington, KentuckyC
- Page 96 and 97: Monroe, LouisianaNew Orleans, Louis
- Page 98 and 99: Suburban MarylandBoston, Massachuse
- Page 100 and 101: Grand Rapids, MichiganLansing, Mich
- Page 102 and 103: St. Louis, MissouriBozeman, Montana
- Page 104 and 105:
Omaha, NebraskaLas Vegas, NevadaCon
- Page 106 and 107:
Portsmouth, New HampshireAtlantic C
- Page 108 and 109:
Ocean/Monmouth Counties (“Shore M
- Page 110 and 111:
Las Cruces, New MexicoAlbany, New Y
- Page 112 and 113:
Asheville, North CarolinaCharlotte,
- Page 114 and 115:
Fargo, North DakotaAkron, OhioConta
- Page 116 and 117:
Cleveland, OhioColumbus, OhioContac
- Page 118 and 119:
Tulsa, OklahomaPortland, OregonCont
- Page 120 and 121:
Bucks County, PennsylvaniaHarrisbur
- Page 122 and 123:
Pittsburgh, PennsylvaniaSchuylkill
- Page 124 and 125:
Greenville/Spartanburg/Anderson Cou
- Page 126 and 127:
Knoxville, TennesseeMemphis, Tennes
- Page 128 and 129:
Beaumont, TexasCorpus Christi, Texa
- Page 130 and 131:
Fort Worth, TexasHouston, TexasCont
- Page 132 and 133:
Texarkana (Bowie County, Texas/Mill
- Page 134 and 135:
Northern VirginiaSeattle/Puget Soun
- Page 136 and 137:
Madison, WisconsinMilwaukee, Wiscon
- Page 138 and 139:
Jackson Hole, WyomingContactNAI Jac
- Page 140:
Build on the power of our network.N


