Shanghai, ChinaXiamen, ChinaContact<strong>NAI</strong> Asia PacificProperties+86 21 6288 7333Country DataArea (KM 2 )GDP Growth (%)GDP 2009 (US$ B)GDP/Capita (US$)Inflation Rate (%)UnemploymentRate (%)Interest Rate(%)6.3458.5%$4,757.74$3,565.73-0.06%4.3%5.31%Population (Millions) 1334.3During the first half of 2009, the overall Chinese economyin general was dominated by a state of deflation characterizedby a slide in consumer and producer prices. Beijing’s US$586 billion stimulus package, coupled with Shanghai’s ownUS $14.5 billion <strong>2010</strong> Expo expenditure, combined to mitigatethe consequences of the downturn.A wave of new supply to the office market during the firsthalf of 2009 and declining demand fueled a rise in citywidevacancy rates as rental rates dropped by as much as25% year-over-year. Although demand has improved,approximately 800,000 SM of office space arrived on themarket in 2009, and is likely to have a negative impact onoccupancy and rental rates in <strong>2010</strong>. During a “wait-andsee”stance in the first half of 2009 by mostinternational organizations, the government adjusted itspolicies on allocating land. Vacancy rates increasedwith several companies, including Intel, closing offices orrelocating outside of the CBD, and rental rates/pricesdeclined, particularly in the suburban areas of the city. Themarket registered increased activity in the second half ofthe year, but did not affect the depressed market rates,which we expect to persist into most of <strong>2010</strong>.Demand throughout 2009 was steady in the retail marketcompared to other sectors with minor reductions inprice/rentals and occupancy rates. Limited new supply ofprime space in the run-up to Expo <strong>2010</strong> is likely to causeincreases in prices/rentals for most of <strong>2010</strong>. Localinvestors dominated the market, especially at the start of2009 when valuations were attractive. The Exchange in Puxiand the Pufa Tower in Pudong were sold to localinvestors. It was only during the second half of 2009 thatmore conservative foreign financial institutions began toshow interest again in the real estate market.The stimulus package, <strong>2010</strong> Expo expenditure and taxrebates combined to reduce Shanghai’s economic falloutfrom a sharp decline in exports during 2009. However, thesepackages cannot fully support the export-oriented economyindefinitely and what the post-stimulus future holds forShanghai's economy and real estate remains to be seen.Contact<strong>NAI</strong> Derun+86 592 5168098Country DataArea (KM 2 )GDP Growth (%)GDP 2009 (US$ B)GDP/Capita (US$)Inflation Rate (%)UnemploymentRate (%)Interest Rate(%)1334.38.5%$4,757.74$3,565.73-0.06%4.3%5.31%Population (Millions) 1334.3Xiamen is not only ranked as the center of high-endconsumption in the Golden Delta of South Fujian Province,but is also the bridgehead for dealing across the TaiwanStrait and Southeast Asia.Land prices in Xiamen’s construction areas increasedsharply in 2009, influenced by the financial crisis; however,housing sales and values saw a decrease early in the yearwith a rebound for both realized after August. The residentialmarket is currently operating with prices at higher levelsthan in years past, resulting in fewer transactions. An adjustmentin price is predicted, which is expected to bring costsdown in both the housing and land sectors.Xiamen has witnessed an increase in development of newClass A office buildings as well as high-end hotels during thepast few years. Although there continues to be sufficientsupply, the leasing transactions of Class A office buildingsremain at a brisk pace in the CBD, especially in areas likeNorth Hubin Street and Lianyue Street. Room rates at bothhigh-end and mid-level hotels continue to rise.In 2009, the Xiamen retail market encompassed a total of3.5 million SM of space with 43,000 retail units/stores, orabout 1.44 SM per capita. The strongest demand is in thehigh-end luxury niche segment, where space fills up veryquickly even though there are many new projects openingto accommodate the demand. Among the new high-endluxury centers are the 12,000 SM Paragon shopping mall,which opened in December 2008 as part of a 100,000 SMmixed-use development, and the 110,000 SM SMII LifeStyle shopping mall, which opened in October 2009. Severalluxury brands entered the Xiamen retail market for the firsttime in 2009, including Gucci, Versace, Prada, Armani,Hermes and Montblanc.Industrial parks saw an increase in activity, keeping manytenants from moving from downtown (Xiamen Island) to thesuburban areas like Haicang, Jimei, Xiang’an and Tong’andistricts. The municipal industrial development bureaucontinued to focus on attracting technology, automotive,logistics, manufacturing and high-end agriculture to thesuburban area.Office rental rates are staggeringly high, which reflects theincreased demand for Class A and B office buildings. Afterthe increase in the housing market after August 2009,prices are expected to adjust to a stable level in <strong>2010</strong>.Shanghai At A GlanceConversion: RMB 6.82 = 1 US$ RENT/M 2 YR US$ RENT/SF/YRLow High Low High VacancyDOWNTOWN OFFICENew Construction (AAA)RMB 1,640.00 RMB 2,920.00 $ 22.34 $ 39.78 60.0%Class A (Prime)RMB 1,460.00 RMB 3,066.00 $ 19.89 $ 41.77 18.0%Class B (Secondary)SUBURBAN OFFICENew Construction (AAA)RMB 1,095.00 RMBRMB 1,022.00 RMB2,190.00 $1,643.00 $14.92 $13.92 $29.8322.3810.0%N/AClass A (Prime)RMB 912.00 RMB 1,570.00 $ 12.42 $ 21.39 N/AClass B (Secondary)INDUSTRIALRMB 657.00 RMB 800.00 $ 8.95 $10.90 N/ABulk WarehouseManufacturingRMBRMB255.00 RMB183.00 RMB438.00 $365.00 $3.47 $2.49 $5.974.9730.0%N/AHigh Tech/R&DRETAILRMB 365.00 RMB 1,460.00 $ 4.97 $ 19.89 N/ADowntownRMB10,950.00 RMB 16,425.00 $ 149.16 $ 223.74 N/ANeighborhood Service CentersCommunity Power CenterRegional MallsSolus Food Stores$N/AN/A109.00 $N/AN/AN/A437.00 $N/AN/AN/A14.85 $N/AN/AN/A59.53N/AN/AN/AN/AN/ADEVELOPMENT LAND Low/M 2 High/M 2 Low/SF High/SFOffice in CBDLand in Office ParksLand in Industrial ParksOffice/Industrial Land - Non-parkRetail/<strong>Commercial</strong> LandResidentialN/A N/A N/A N/ARMB 1,500.00 RMB 2,000.00 $ 219.94 $ 293.26RMB 450.00 RMB 2,000.00 $ 65.98 $ 293.26N/A N/A N/A N/AN/A N/A N/A N/AN/A N/A N/A N/AXiamen At A GlanceConversion: 6.82 RMB = 1 US$ RENT/M 2 /MO US$ RENT/SF/YRLow High Low High VacancyDOWNTOWN OFFICENew Construction (AAA)Class A (Prime)Class B (Secondary)SUBURBAN OFFICENew Construction (AAA)Class A (Prime)Class B (Secondary)INDUSTRIALBulk WarehouseManufacturingHigh Tech/R&DRETAILRMBRMBRMBRMBRMBRMBRMBRMB14.0015.008.00N/A7.005.001.001.005.20RMBRMBRMBRMBRMBRMBRMBRMB23.0028.5015.00N/A13.0010.003.503.0013.80$$$$$$$$15.6116.728.92N/A7.805.571.111.115.80$$$$$$$$25.6431.7716.72N/A14.4911.153.903.3415.385.0%N/A3.0%N/A8.0%10.0%15.0%28.0%10.0%DowntownRMB 70.00 RMB 180.00 $ 78.04 $ 200.67 2.0%Neighborhood Service CentersCommunity Power Center (Big Box)Regional MallsSolus Food StoresRMBRMBRMBRMB10.005.0048.006.00RMBRMBRMBRMB55.0025.0065.0035.00$$$$11.15.5753.516.69$$$$61.3227.8772.4639.028.0%12.0%9.0%23.0%DEVELOPMENT LAND Low/M 2 High/M 2 Low/Acre High/AcreOffice in CBDLand in Office Parks)Land in Industrial ParksOffice/Industrial Land - Non-parkRetail/<strong>Commercial</strong> LandResidentialN/A N/A N/A N/AN/A N/A N/A N/AN/A N/A N/A N/AN/A N/A N/A N/AN/A N/A N/A N/AN/A N/A N/A N/A<strong>2010</strong> <strong>Global</strong> <strong>Market</strong> <strong>Report</strong> ■ www.naiglobal.com 29
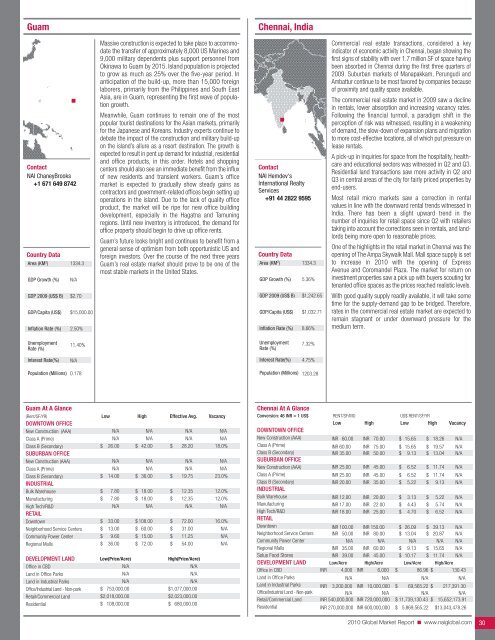
GuamChennai, IndiaContact<strong>NAI</strong> ChaneyBrooks+1 671 649 8742Country DataArea (KM 2 )GDP Growth (%)GDP 2009 (US$ B)GDP/Capita (US$)Inflation Rate (%)1334.3N/A$2.70$15,000.002.50%Massive construction is expected to take place to accommodatethe transfer of approximately 8,000 US Marines and9,000 military dependents plus support personnel fromOkinawa to Guam by 2015. Island population is projectedto grow as much as 25% over the five-year period. Inanticipation of the build-up, more than 15,000 foreignlaborers, primarily from the Philippines and South EastAsia, are in Guam, representing the first wave of populationgrowth.Meanwhile, Guam continues to remain one of the mostpopular tourist destinations for the Asian markets, primarilyfor the Japanese and Koreans. Industry experts continue todebate the impact of the construction and military build-upon the island’s allure as a resort destination. The growth isexpected to result in pent up demand for industrial, residentialand office products, in this order. Hotels and shoppingcenters should also see an immediate benefit from the influxof new residents and transient workers. Guam’s officemarket is expected to gradually show steady gains ascontractors and government-related offices begin setting upoperations in the island. Due to the lack of quality officeproduct, the market will be ripe for new office buildingdevelopment, especially in the Hagatna and Tamuningregions. Until new inventory is introduced, the demand foroffice property should begin to drive up office rents.Guam’s future looks bright and continues to benefit from ageneral sense of optimism from both opportunistic US andforeign investors. Over the course of the next three yearsGuam’s real estate market should prove to be one of themost stable markets in the United States.Contact<strong>NAI</strong> Hemdev'sInternational <strong>Real</strong>tyServices+91 44 2822 9595Country DataArea (KM 2 )GDP Growth (%)GDP 2009 (US$ B)GDP/Capita (US$)Inflation Rate (%)1334.35.36%$1,242.65$1,032.718.66%<strong>Commercial</strong> real estate transactions, considered a keyindicator of economic activity in Chennai, began showing thefirst signs of stability with over 1.7 million SF of space havingbeen absorbed in Chennai during the first three quarters of2009. Suburban markets of Manapakkam, Perungudi andAmbattur continue to be most favored by companies becauseof proximity and quality space available.The commercial real estate market in 2009 saw a declinein rentals, lower absorption and increasing vacancy rates.Following the financial turmoil, a paradigm shift in theperception of risk was witnessed, resulting in a weakeningof demand, the slow-down of expansion plans and migrationto more cost-effective locations, all of which put pressure onlease rentals.A pick-up in inquiries for space from the hospitality, healthcareand educational sectors was witnessed in Q2 and Q3.Residential land transactions saw more activity in Q2 andQ3 in central areas of the city for fairly priced properties byend-users.Most retail micro markets saw a correction in rentalvalues in line with the downward rental trends witnessed inIndia. There has been a slight upward trend in thenumber of inquiries for retail space since Q2 with retailerstaking into account the corrections seen in rentals, and landlordsbeing more open to reasonable prices.One of the highlights in the retail market in Chennai was theopening of The Ampa Skywalk Mall. Mall space supply is setto increase in <strong>2010</strong> with the opening of ExpressAvenue and Coromandel Plaza. The market for return oninvestment properties saw a pick up with buyers scouting fortenanted office spaces as the prices reached realistic levels.With good quality supply readily available, it will take sometime for the supply-demand gap to be bridged. Therefore,rates in the commercial real estate market are expected toremain stagnant or under downward pressure for themedium term.UnemploymentRate (%)11.40%UnemploymentRate (%)7.32%Interest Rate(%)N/AInterest Rate(%)4.75%Population (Millions)0.178Population (Millions) 1203.28Guam At A Glance(Rent/SF/YR) Low High Effective Avg. VacancyDOWNTOWN OFFICENew Construction (AAA)Class A (Prime)Class B (Secondary)SUBURBAN OFFICENew Construction (AAA)Class A (Prime)Class B (Secondary)INDUSTRIALBulk WarehouseManufacturingHigh Tech/R&DRETAILDowntownNeighborhood Service CentersCommunity Power CenterRegional Malls$$$$$$$$N/AN/A26.00N/AN/A14.007.807.80N/A33.0013.009.6036.00N/AN/A$ 42.00N/AN/A$ 36.00$ 18.00$ 18.00N/A$ 108.00$ 60.00$ 15.00$ 72.00$$$$$$$$N/AN/A28.20N/AN/A19.7512.3512.35N/A72.0031.0011.2554.00N/AN/A18.0%N/AN/A23.0%12.0%12.0%N/A16.0%N/AN/AN/ADEVELOPMENT LANDOffice in CBDLand in Office ParksLand in Industrial ParksOffice/Industrial Land - Non-parkRetail/<strong>Commercial</strong> LandResidentialLow(Price/Acre)High(Price/Acre)N/AN/AN/AN/AN/AN/A$ 753,000.00 $1,077,000.00$2,018,000.00 $2,023,000.00$ 108,000.00 $ 680,000.00Chennai At A GlanceConversion: 46 INR = 1 US$ RENT/SF/MO US$ RENT/SF/YRLow High Low High VacancyDOWNTOWN OFFICENew Construction (AAA)Class A (Prime)INR 60.00INR 60.00INR 70.00INR 75.00$ 15.65$ 15.65$$18.2619.57N/AN/AClass B (Secondary)SUBURBAN OFFICENew Construction (AAA)Class A (Prime)Class B (Secondary)INDUSTRIALBulk WarehouseManufacturingHigh Tech/R&DRETAILINR 35.00INR 25.00INR 25.00INR 20.00INR 12.00INR 17.00INR 18.00INR 50.00INR 45.00INR 45.00INR 35.00INR 20.00INR 22.00INR 25.00$$$$$$$9.136.526.525.223.134.434.70$$$$$$$13.0411.7411.749.135.225.746.52N/AN/AN/AN/AN/AN/AN/ADowntownNeighborhood Service CentersCommunity Power CenterINR 100.00INR 50.00N/AINR 150.00INR 80.00N/A$ 26.09$ 13.04N/A$$39.1320.87N/AN/AN/AN/ARegional MallsINR 35.00 INR 60.00 $ 9.13 $ 15.65 N/ASolus Food StoresDEVELOPMENT LANDINR 39.00Low/AcreINR 45.00High/Acre$ 10.17Low/Acre$ 11.74High/AcreN/AOffice in CBDLand in Office ParksLand in Industrial ParksOffice/Industrial Land - Non-parkRetail/<strong>Commercial</strong> LandResidentialINR 4,000 INR 6,000 $ 86.96 $ 130.43N/A N/A N/A N/AINR 3,200,000 INR 10,000,000 $ 69,565.22 $ 217,391.30N/A N/A N/A N/AINR 540,000,000 INR 720,000,000 $ 11,739,130.43 $ 15,652,173.91INR 270,000,000 INR 600,000,000 $ 5,869,565.22 $13,043,478.26<strong>2010</strong> <strong>Global</strong> <strong>Market</strong> <strong>Report</strong> ■ www.naiglobal.com 30
- Page 1 and 2: CommercialCommercial Real Estate Se
- Page 3 and 4: ■ ■ ■ Table of ContentsGENERA
- Page 5 and 6: Global OutlookCommercial real estat
- Page 7 and 8: 38.3% in November 2009. At the same
- Page 9 and 10: quality than the Census properties.
- Page 11 and 12: SaskatchewanSaskatchewan is a small
- Page 13 and 14: As 2009 draws to a close, there is
- Page 15 and 16: Global investment interest largely
- Page 18 and 19: ChinaChina continued to post large
- Page 20 and 21: MalaysiaWith Malaysia’s dependenc
- Page 22 and 23: ■ US Highlights - Northeast Regio
- Page 24 and 25: ■ US Highlights - Midwest Region
- Page 26 and 27: ■ US Highlights - West Region■
- Page 28 and 29: Melbourne, AustraliaBeijing, ChinaC
- Page 32 and 33: Delhi, Gurgaon, IndiaHyderabad, Pra
- Page 34 and 35: Punjab, IndiaTokyo, JapanContactNAI
- Page 36 and 37: Seoul, South KoreaTaipei, TaiwanCon
- Page 38 and 39: Calgary, Alberta, CanadaEdmonton, A
- Page 40 and 41: Halifax, Nova Scotia, CanadaOttawa,
- Page 42 and 43: Regina, Saskatchewan, CanadaContact
- Page 44 and 45: Vienna, AustriaThe Baltics (Latvia/
- Page 46 and 47: Copenhagen, DenmarkFinlandContactNA
- Page 48 and 49: Athens, GreeceReykjavik IcelandCont
- Page 50 and 51: KuwaitOslo, NorwayContactNAI Kuwait
- Page 52 and 53: Moscow, Russian FederationSt. Peter
- Page 54 and 55: Madrid, SpainStockholm, SwedenConta
- Page 56 and 57: Istanbul, TurkeyKiev, UkraineContac
- Page 58 and 59: Latin AmericaSECTION CONTENTSBuenos
- Page 60 and 61: Campinas, BrazilCuritiba, BrazilCon
- Page 62 and 63: Sao Paulo, BrazilSantiago, ChileCon
- Page 64 and 65: Ciudad Juarez, Chihuahua, MexicoGua
- Page 66 and 67: Matamoros, Tamaulipas, MexicoMexica
- Page 68 and 69: Reynosa, MexicoSaltillo, Coahuila,
- Page 70 and 71: Torreon, Coahulia, MexicoCaracas, V
- Page 72 and 73: Birmingham, AlabamaHuntsville, Deca
- Page 74 and 75: Jonesboro, ArkansasLittle Rock, Ark
- Page 76 and 77: Marin County, CaliforniaMonterey, C
- Page 78 and 79: Sacramento, CaliforniaSan Diego, Ca
- Page 80 and 81:
Santa Clara County (Silicon Valley)
- Page 82 and 83:
Colorado Springs, ColoradoDenver, C
- Page 84 and 85:
Fort Lauderdale, FloridaFt. Myers/N
- Page 86 and 87:
Miami, FloridaOrlando, FloridaConta
- Page 88 and 89:
Atlanta, GeorgiaHonolulu, HawaiiCon
- Page 90 and 91:
Chicago, IllinoisSpringfield, Illin
- Page 92 and 93:
Cedar Rapids, Iowa City, IowaDavenp
- Page 94 and 95:
Wichita, KansasLexington, KentuckyC
- Page 96 and 97:
Monroe, LouisianaNew Orleans, Louis
- Page 98 and 99:
Suburban MarylandBoston, Massachuse
- Page 100 and 101:
Grand Rapids, MichiganLansing, Mich
- Page 102 and 103:
St. Louis, MissouriBozeman, Montana
- Page 104 and 105:
Omaha, NebraskaLas Vegas, NevadaCon
- Page 106 and 107:
Portsmouth, New HampshireAtlantic C
- Page 108 and 109:
Ocean/Monmouth Counties (“Shore M
- Page 110 and 111:
Las Cruces, New MexicoAlbany, New Y
- Page 112 and 113:
Asheville, North CarolinaCharlotte,
- Page 114 and 115:
Fargo, North DakotaAkron, OhioConta
- Page 116 and 117:
Cleveland, OhioColumbus, OhioContac
- Page 118 and 119:
Tulsa, OklahomaPortland, OregonCont
- Page 120 and 121:
Bucks County, PennsylvaniaHarrisbur
- Page 122 and 123:
Pittsburgh, PennsylvaniaSchuylkill
- Page 124 and 125:
Greenville/Spartanburg/Anderson Cou
- Page 126 and 127:
Knoxville, TennesseeMemphis, Tennes
- Page 128 and 129:
Beaumont, TexasCorpus Christi, Texa
- Page 130 and 131:
Fort Worth, TexasHouston, TexasCont
- Page 132 and 133:
Texarkana (Bowie County, Texas/Mill
- Page 134 and 135:
Northern VirginiaSeattle/Puget Soun
- Page 136 and 137:
Madison, WisconsinMilwaukee, Wiscon
- Page 138 and 139:
Jackson Hole, WyomingContactNAI Jac
- Page 140:
Build on the power of our network.N


