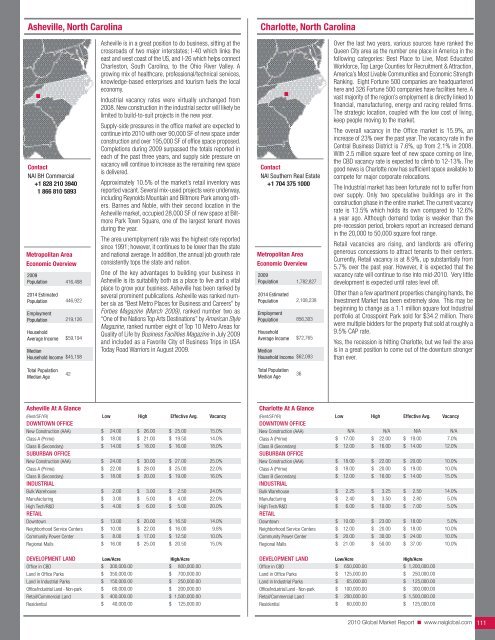
Asheville, North CarolinaCharlotte, North CarolinaContact<strong>NAI</strong> BH <strong>Commercial</strong>+1 828 210 39401 866 810 5893Metropolitan AreaEconomic Overview2009Population2014 EstimatedPopulationEmploymentPopulationHouseholdAverage IncomeMedianHousehold Income416,498446,922219,126$59,194$45,198Asheville is in a great position to do business, sitting at thecrossroads of two major interstates; I-40 which links theeast and west coast of the US, and I-26 which helps connectCharleston, South Carolina, to the Ohio River Valley. Agrowing mix of healthcare, professional/technical services,knowledge-based enterprises and tourism fuels the localeconomy.Industrial vacancy rates were virtually unchanged from2008. New construction in the industrial sector will likely belimited to build-to-suit projects in the new year.Supply-side pressures in the office market are expected tocontinue into <strong>2010</strong> with over 90,000 SF of new space underconstruction and over 195,000 SF of office space proposed.Completions during 2009 surpassed the totals reported ineach of the past three years, and supply side pressure onvacancy will continue to increase as the remaining new spaceis delivered.Approximately 10.5% of the market’s retail inventory wasreported vacant. Several mix-used projects were underway,including Reynolds Mountain and Biltmore Park among others.Barnes and Noble, with their second location in theAsheville market, occupied 28,000 SF of new space at BiltmorePark Town Square, one of the largest tenant movesduring the year.The area unemployment rate was the highest rate reportedsince 1991; however, it continues to be lower than the stateand national average. In addition, the annual job growth rateconsistently tops the state and nation.One of the key advantages to building your business inAsheville is its suitability both as a place to live and a vitalplace to grow your business. Asheville has been ranked byseveral prominent publications. Asheville was ranked numbersix as “Best Metro Places for Business and Careers” byForbes Magazine (March 2009), ranked number two as“One of the Nations Top Arts Destinations” by American StyleMagazine, ranked number eight of Top 10 Metro Areas forQuality of Life by Business Facilities Magazine in July 2009and included as a Favorite City of Business Trips in USAToday Road Warriors in August 2009.Contact<strong>NAI</strong> Southern <strong>Real</strong> <strong>Estate</strong>+1 704 375 1000Metropolitan AreaEconomic Overview2009Population2014 EstimatedPopulationEmploymentPopulationHouseholdAverage IncomeMedianHousehold Income1,782,8272,108,238856,303$72,765$62,093Over the last two years, various sources have ranked theQueen City area as the number one place in America in thefollowing categories: Best Place to Live, Most EducatedWorkforce, Top Large Counties for Recruitment & Attraction,America’s Most Livable Communities and Economic StrengthRanking. Eight Fortune 500 companies are headquarteredhere and 326 Fortune 500 companies have facilities here. Avast majority of the region’s employment is directly linked tofinancial, manufacturing, energy and racing related firms.The strategic location, coupled with the low cost of living,keep people moving to the market.The overall vacancy in the Office market is 15.9%, anincrease of 23% over the past year. The vacancy rate in theCentral Business District is 7.6%, up from 2.1% in 2008.With 2.5 million square feet of new space coming on line,the CBD vacancy rate is expected to climb to 12-13%. Thegood news is Charlotte now has sufficient space available tocompete for major corporate relocations.The Industrial market has been fortunate not to suffer fromover supply. Only two speculative buildings are in theconstruction phase in the entire market. The current vacancyrate is 13.5% which holds its own compared to 12.6%a year ago. Although demand today is weaker than thepre-recession period, brokers report an increased demandin the 20,000 to 50,000 square foot range.Retail vacancies are rising, and landlords are offeringgenerous concessions to attract tenants to their centers.Currently, Retail vacancy is at 8.9%, up substantially from5.7% over the past year. However, it is expected that thevacancy rate will continue to rise into mid-<strong>2010</strong>. Very littledevelopment is expected until rates level off.Other than a few apartment properties changing hands, theInvestment <strong>Market</strong> has been extremely slow. This may bebeginning to change as a 1.1 million square foot Industrialportfolio at Crosspoint Park sold for $34.2 million. Therewere multiple bidders for the property that sold at roughly a9.5% CAP rate.Yes, the recession is hitting Charlotte, but we feel the areais in a great position to come out of the downturn strongerthan ever.Total PopulationMedian Age42Total PopulationMedian Age36Asheville At A Glance(Rent/SF/YR) Low High Effective Avg. VacancyDOWNTOWN OFFICENew Construction (AAA)Class A (Prime)Class B (Secondary)SUBURBAN OFFICENew Construction (AAA)Class A (Prime)Class B (Secondary)INDUSTRIAL$$$$$$24.0018.0014.0024.0022.0018.00$$$$$$26.0021.0018.0030.0028.0020.00$ 25.00$ 19.50$ 16.00$ 27.00$ 25.00$ 19.0015.0%14.0%18.0%25.0%22.0%16.0%Bulk WarehouseManufacturingHigh Tech/R&DRETAIL$$$2.003.004.00$$$3.005.006.00$$$2.504.005.0024.0%22.0%20.0%DowntownNeighborhood Service CentersCommunity Power CenterRegional Malls$$$$13.0010.008.0016.00$$$$20.0022.0017.0025.00$ 16.50$ 16.00$ 12.50$ 20.5014.0%9.8%10.0%15.0%DEVELOPMENT LAND Low/Acre High/AcreOffice in CBDLand in Office ParksLand in Industrial ParksOffice/Industrial Land - Non-park$$$$300,000.00350,000.00150,000.0060,000.00$$$$800,000.00700,000.00250,000.00200,000.00Retail/<strong>Commercial</strong> Land$ 400,000.00 $ 1,500,000.00Residential$ 40,000.00 $ 125,000.00Charlotte At A Glance(Rent/SF/YR) Low High Effective Avg. VacancyDOWNTOWN OFFICENew Construction (AAA)Class A (Prime)Class B (Secondary)SUBURBAN OFFICENew Construction (AAA)Class A (Prime)Class B (Secondary)INDUSTRIALBulk WarehouseManufacturingHigh Tech/R&DRETAILDowntownNeighborhood Service CentersCommunity Power CenterRegional Malls$$$$$$$$$$$$N/A17.0012.0018.0018.0012.002.252.406.0010.0012.0020.0021.00$$$$$$$$$$$$N/A22.0016.0022.0020.0016.003.253.5010.0023.0020.0030.0050.00$$$$$$$$$$$$N/A19.0014.0020.0019.0014.002.502.807.0018.0018.0024.0037.00N/A7.0%12.0%10.0%10.0%15.0%14.0%5.0%5.0%5.0%10.0%10.0%10.0%DEVELOPMENT LAND Low/Acre High/AcreOffice in CBD$ 650,000.00 $ 1,200,000.00Land in Office ParksLand in Industrial ParksOffice/Industrial Land - Non-park$$$125,000.0065,000.00100,000.00$$$250,000.00125,000.00300,000.00Retail/<strong>Commercial</strong> Land$ 200,000.00 $ 1,500,000.00Residential$ 60,000.00 $ 125,000.00<strong>2010</strong> <strong>Global</strong> <strong>Market</strong> <strong>Report</strong> ■ www.naiglobal.com 111
Greensboro/High Point/Winston-Salem, North CarolinaRaleigh/Durham, North CarolinaContact<strong>NAI</strong> Piedmont Triad+1 336 373 0995Metropolitan AreaEconomic Overview2008Population2013 EstimatedPopulationEmploymentPopulationHouseholdAverage IncomeMedianHousehold IncomeTotal PopulationMedian Age722,220781,425407,900$59,036$51,43939Infrastructure improvements bode well for the future of theregion. Expansion of a third runway and major road improvementshave resulted in a $300 million FedEx Mid-Atlantichub opening at the airport and the location of a 400,000 SFFedEx Ground sorting facility in Kernersville. HondaJet hasopened a headquarters facility at the airport and will deliverthe first of its six-passenger light jets in 2011.The industrial market suffered its share of setbacks in 2009,with an unemployment rate over 11% and the closing of theflagship 790,000 SF Dell manufacturing plant in UnionCross. Industrial vacancies for modern distribution centersover 200,000 SF exceed 6 million SF, an estimated 10-yearsupply at historic absorption levels. The only bright spot isincreased demand for warehouse space between 20,000and 40,000 SF with rents leveling out in the $3.00-$3.50/SF range for good quality space at the airport.The retail sector has continued to deteriorate with smallshop vacancies reaching 25% and tenants going out ofbusiness faster than the landlords can lease the space.Restaurants and boutique shopping have been particularlyhard hit as consumers continue to cut back on spending.Food anchored neighborhood centers are faring better thanother product types, with rents for small shops declining byonly 20%. The forecast for <strong>2010</strong> is more of the same, withlittle hope of substantial improvement until 2012.The office market has followed other market segments, withcutbacks caused by Wachovia’s demise freeing up largeblocks of space in downtown Winston-Salem. Vacancy isover 20% in all markets. There are sporadic signs of activitywith a financial services arm of LabCorp bringing 383 jobsto Greensboro by Q2 <strong>2010</strong>.Public sector investment has been strong, with UNC-G andNC A&T universities breaking ground on a $60 million centerfor Nanotechnology in east Greensboro. Guilford TechnicalCommunity College is also under way with a $150 millionAirport Campus that will specialize in the aviation and logisticsindustries.Contact<strong>NAI</strong> Carolantic <strong>Real</strong>ty, Inc.+1 919 832 0594Metropolitan AreaEconomic Overview2009Population2014 EstimatedPopulationEmploymentPopulationHouseholdAverage IncomeMedianHousehold IncomeTotal PopulationMedian Age1,150,3051,404,352540,316$75,927$66,96736In May 2009, MSNBC named Raleigh-Durham number twoin the nation for the top five markets likely to recoverquickly. This analysis was based on good job growth, growingpopulation, good weather, lots of first-time home buyers,little overbuilding, vital downtowns where people can livewithout a car, a well educated population, and a large numberof foreclosures that happened early. Fortunately, the regionis also home to the Research Triangle Park, one of the mostsuccessful R&D centers in the world, featuring microelectronics,environmental sciences, pharmaceuticals, andbiotechnology companies.The Triangle area continued to attract new businesses aswell as domestic and international expansions despite thedownturn in the economy. The Triangle Combined MSAadded an average of 10,254 jobs per year (July to June)over the 7-year period ending in June 2009 resulting in anaverage 1.5% annual growth rate. Companies like EMCCorporation announced plans for a $280 million expansionthat will add almost 400 jobs over the next five years.Deutsche Bank will open a technology development centercreating over 300 jobs and investing $6.7 million.However, even with the growth, concerns about the nationaleconomy were reflected in the local office market whichpointed to a rise in vacancy as tenants downsized and newsublease space brought additional pressures. Vacancy rosetwo percentage points higher from 2008 to 15% withminimal net demand. Approximately 1.4 million squarefeet were added to the market during 2009 and rentalrates dropped slightly with concessions offered on extendedleases. Less than 500,000 square feet were underconstruction for <strong>2010</strong>.Somewhat surprising, the multipurpose sector experienceda slight drop in vacancy from 16% in 2008 to 15% in 2009with 3% absorption. Uncertainties in the overall economyand financial markets will test this sector into <strong>2010</strong>. Rentalrates declined and approximately 300,000 square feet wereunder construction for <strong>2010</strong>.Over 1.4 million square feet of retail space was completedin the Raleigh-Durham market in 2009 with an additional900,000 square feet now under construction. Vacancy rosefrom 4% in 2008 to 6% in 2009 and absorption remainedat 3%. Rental rates declined slightly. As constructioncontinues on the Outer Loop (I-540) around Raleigh, newretail opportunities will be opened at major interchanges.Greensboro, High Point, Winston-Salem At A Glance(Rent/SF/YR) Low High Effective Avg. VacancyDOWNTOWN OFFICENew Construction (AAA)Class A (Prime)Class B (Secondary)SUBURBAN OFFICENew Construction (AAA)Class A (Prime)Class B (Secondary)INDUSTRIALBulk WarehouseManufacturingHigh Tech/R&DRETAILDowntownNeighborhood Service CentersCommunity Power CenterRegional Malls$$$$$$$$$$$$22.0018.5011.0021.0018.5011.002.003.50N/A8.0012.0016.0022.00$$$$$$$$$$$$28.0021.0015.0026.0022.0016.003.504.75N/A23.0020.0024.0040.00$$$$$$$$$$$$25.0019.5013.5023.0019.0013.003.254.00N/A16.0018.0020.0028.00N/A8.0%25.0%N/A15.0%20.0%15.0%10.0%N/A15.0%20.0%12.0%12.0%DEVELOPMENT LAND Low/Acre High/AcreOffice in CBD$ 700,000.00 $ 2,000,000.00Land in Office ParksLand in Industrial ParksOffice/Industrial Land - Non-parkRetail/<strong>Commercial</strong> LandResidential$$$$$100,000.0075,000.0050,000.00125,000.0020,000.00$$$$$300,000.00150,000.00100,000.00250,000.0075,000.00Raleigh/Durham At A Glance(Rent/SF/YR) Low High Effective Avg. VacancyDOWNTOWN OFFICENew Construction (AAA)Class A (Prime)Class B (Secondary)SUBURBAN OFFICENew Construction (AAA)Class A (Prime)Class B (Secondary)INDUSTRIAL$$$$$$25.0018.0014.0024.0019.0014.00$$$$$$28.9525.0017.0030.0024.0016.50$ 26.98$ 21.50$ 15.50$ 27.00$ 21.50$ 15.5012.0%12.0%12.0%15.0%15.0%15.0%Bulk WarehouseManufacturingHigh Tech/R&DRETAIL$$$3.253.507.50$$$4.504.5011.00$$$3.754.009.0015.0%15.0%15.0%DowntownNeighborhood Service CentersCommunity Power CenterRegional Malls$$$$8.0010.0014.0021.00$$$$23.0016.0024.0045.00$ 15.50$ 13.00$ 19.00$ 33.006.0%6.0%6.0%6.0%DEVELOPMENT LAND Low/Acre High/AcreOffice in CBDLand in Office ParksLand in Industrial ParksOffice/Industrial Land - Non-parkRetail/<strong>Commercial</strong> LandResidential$$$$$$50.00175,000.00100,000.0080,000.00152,460.0025,000.00$$$$$$90.00225,000.00175,000.00200,000.00750,000.00150,000.00<strong>2010</strong> <strong>Global</strong> <strong>Market</strong> <strong>Report</strong> ■ www.naiglobal.com 112
- Page 1 and 2:
CommercialCommercial Real Estate Se
- Page 3 and 4:
■ ■ ■ Table of ContentsGENERA
- Page 5 and 6:
Global OutlookCommercial real estat
- Page 7 and 8:
38.3% in November 2009. At the same
- Page 9 and 10:
quality than the Census properties.
- Page 11 and 12:
SaskatchewanSaskatchewan is a small
- Page 13 and 14:
As 2009 draws to a close, there is
- Page 15 and 16:
Global investment interest largely
- Page 18 and 19:
ChinaChina continued to post large
- Page 20 and 21:
MalaysiaWith Malaysia’s dependenc
- Page 22 and 23:
■ US Highlights - Northeast Regio
- Page 24 and 25:
■ US Highlights - Midwest Region
- Page 26 and 27:
■ US Highlights - West Region■
- Page 28 and 29:
Melbourne, AustraliaBeijing, ChinaC
- Page 30 and 31:
Shanghai, ChinaXiamen, ChinaContact
- Page 32 and 33:
Delhi, Gurgaon, IndiaHyderabad, Pra
- Page 34 and 35:
Punjab, IndiaTokyo, JapanContactNAI
- Page 36 and 37:
Seoul, South KoreaTaipei, TaiwanCon
- Page 38 and 39:
Calgary, Alberta, CanadaEdmonton, A
- Page 40 and 41:
Halifax, Nova Scotia, CanadaOttawa,
- Page 42 and 43:
Regina, Saskatchewan, CanadaContact
- Page 44 and 45:
Vienna, AustriaThe Baltics (Latvia/
- Page 46 and 47:
Copenhagen, DenmarkFinlandContactNA
- Page 48 and 49:
Athens, GreeceReykjavik IcelandCont
- Page 50 and 51:
KuwaitOslo, NorwayContactNAI Kuwait
- Page 52 and 53:
Moscow, Russian FederationSt. Peter
- Page 54 and 55:
Madrid, SpainStockholm, SwedenConta
- Page 56 and 57:
Istanbul, TurkeyKiev, UkraineContac
- Page 58 and 59:
Latin AmericaSECTION CONTENTSBuenos
- Page 60 and 61:
Campinas, BrazilCuritiba, BrazilCon
- Page 62 and 63: Sao Paulo, BrazilSantiago, ChileCon
- Page 64 and 65: Ciudad Juarez, Chihuahua, MexicoGua
- Page 66 and 67: Matamoros, Tamaulipas, MexicoMexica
- Page 68 and 69: Reynosa, MexicoSaltillo, Coahuila,
- Page 70 and 71: Torreon, Coahulia, MexicoCaracas, V
- Page 72 and 73: Birmingham, AlabamaHuntsville, Deca
- Page 74 and 75: Jonesboro, ArkansasLittle Rock, Ark
- Page 76 and 77: Marin County, CaliforniaMonterey, C
- Page 78 and 79: Sacramento, CaliforniaSan Diego, Ca
- Page 80 and 81: Santa Clara County (Silicon Valley)
- Page 82 and 83: Colorado Springs, ColoradoDenver, C
- Page 84 and 85: Fort Lauderdale, FloridaFt. Myers/N
- Page 86 and 87: Miami, FloridaOrlando, FloridaConta
- Page 88 and 89: Atlanta, GeorgiaHonolulu, HawaiiCon
- Page 90 and 91: Chicago, IllinoisSpringfield, Illin
- Page 92 and 93: Cedar Rapids, Iowa City, IowaDavenp
- Page 94 and 95: Wichita, KansasLexington, KentuckyC
- Page 96 and 97: Monroe, LouisianaNew Orleans, Louis
- Page 98 and 99: Suburban MarylandBoston, Massachuse
- Page 100 and 101: Grand Rapids, MichiganLansing, Mich
- Page 102 and 103: St. Louis, MissouriBozeman, Montana
- Page 104 and 105: Omaha, NebraskaLas Vegas, NevadaCon
- Page 106 and 107: Portsmouth, New HampshireAtlantic C
- Page 108 and 109: Ocean/Monmouth Counties (“Shore M
- Page 110 and 111: Las Cruces, New MexicoAlbany, New Y
- Page 114 and 115: Fargo, North DakotaAkron, OhioConta
- Page 116 and 117: Cleveland, OhioColumbus, OhioContac
- Page 118 and 119: Tulsa, OklahomaPortland, OregonCont
- Page 120 and 121: Bucks County, PennsylvaniaHarrisbur
- Page 122 and 123: Pittsburgh, PennsylvaniaSchuylkill
- Page 124 and 125: Greenville/Spartanburg/Anderson Cou
- Page 126 and 127: Knoxville, TennesseeMemphis, Tennes
- Page 128 and 129: Beaumont, TexasCorpus Christi, Texa
- Page 130 and 131: Fort Worth, TexasHouston, TexasCont
- Page 132 and 133: Texarkana (Bowie County, Texas/Mill
- Page 134 and 135: Northern VirginiaSeattle/Puget Soun
- Page 136 and 137: Madison, WisconsinMilwaukee, Wiscon
- Page 138 and 139: Jackson Hole, WyomingContactNAI Jac
- Page 140: Build on the power of our network.N