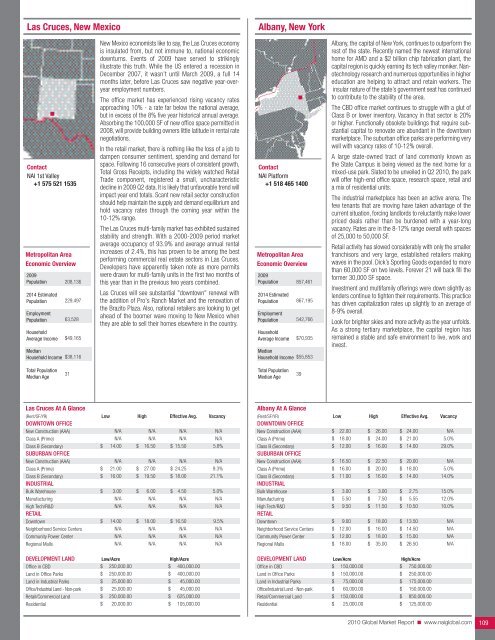
Las Cruces, New MexicoAlbany, New YorkContact<strong>NAI</strong> 1st Valley+1 575 521 1535Metropolitan AreaEconomic Overview2009Population2014 EstimatedPopulationEmploymentPopulationHouseholdAverage IncomeMedianHousehold Income208,136229,49763,528$49,165$38,116New Mexico economists like to say, the Las Cruces economyis insulated from, but not immune to, national economicdownturns. Events of 2009 have served to strikinglyillustrate this truth. While the US entered a recession inDecember 2007, it wasn’t until March 2009, a full 14months later, before Las Cruces saw negative year-overyearemployment numbers.The office market has experienced rising vacancy ratesapproaching 10% - a rate far below the national average,but in excess of the 8% five year historical annual average.Absorbing the 100,000 SF of new office space permitted in2008, will provide building owners little latitude in rental ratenegotiations.In the retail market, there is nothing like the loss of a job todampen consumer sentiment, spending and demand forspace. Following 16 consecutive years of consistent growth,Total Gross Receipts, including the widely watched RetailTrade component, registered a small, uncharacteristicdecline in 2009 Q2 data. It is likely that unfavorable trend willimpact year end totals. Scant new retail sector constructionshould help maintain the supply and demand equilibrium andhold vacancy rates through the coming year within the10-12% range.The Las Cruces multi-family market has exhibited sustainedstability and strength. With a 2000-2009 period marketaverage occupancy of 93.9% and average annual rentalincreases of 2.4%, this has proven to be among the bestperforming commercial real estate sectors in Las Cruces.Developers have apparently taken note as more permitswere drawn for multi-family units in the first two months ofthis year than in the previous two years combined.Las Cruces will see substantial "downtown" renewal withthe addition of Pro's Ranch <strong>Market</strong> and the renovation ofthe Brazito Plaza. Also, national retailers are looking to getahead of the boomer wave moving to New Mexico whenthey are able to sell their homes elsewhere in the country.Contact<strong>NAI</strong> Platform+1 518 465 1400Metropolitan AreaEconomic Overview2009Population2014 EstimatedPopulationEmploymentPopulationHouseholdAverage IncomeMedianHousehold Income857,461867,195542,766$70,935$55,853Albany, the capital of New York, continues to outperform therest of the state. Recently named the newest internationalhome for AMD and a $2 billion chip fabrication plant, thecapital region is quickly earning its tech valley moniker. Nanotechnologyresearch and numerous opportunities in highereducation are helping to attract and retain workers. Theinsular nature of the state’s government seat has continuedto contribute to the stability of the area.The CBD office market continues to struggle with a glut ofClass B or lower inventory. Vacancy in that sector is 20%or higher. Functionally obsolete buildings that require substantialcapital to renovate are abundant in the downtownmarketplace. The suburban office parks are performing verywell with vacancy rates of 10-12% overall.A large state-owned tract of land commonly known asthe State Campus is being viewed as the next home for amixed-use park. Slated to be unveiled in Q2 <strong>2010</strong>, the parkwill offer high-end office space, research space, retail anda mix of residential units.The industrial marketplace has been an active arena. Thefew tenants that are moving have taken advantage of thecurrent situation, forcing landlords to reluctantly make lowerpriced deals rather than be burdened with a year-longvacancy. Rates are in the 8-12% range overall with spacesof 25,000 to 50,000 SF.Retail activity has slowed considerably with only the smallerfranchisors and very large, established retailers makingwaves in the pool. Dick’s Sporting Goods expanded to morethan 60,000 SF on two levels. Forever 21 will back fill theformer 30,000 SF space.Investment and multifamily offerings were down slightly aslenders continue to tighten their requirements. This practicehas driven capitalization rates up slightly to an average of8-9% overall.Look for brighter skies and more activity as the year unfolds.As a strong tertiary marketplace, the capital region hasremained a stable and safe environment to live, work andinvest.Total PopulationMedian Age31Total PopulationMedian Age39Las Cruces At A Glance(Rent/SF/YR) Low High Effective Avg. VacancyDOWNTOWN OFFICENew Construction (AAA)Class A (Prime)Class B (Secondary)SUBURBAN OFFICENew Construction (AAA)Class A (Prime)Class B (Secondary)INDUSTRIAL$$$N/AN/A14.00N/A21.0016.00$$$N/AN/A16.50N/A27.0019.50N/AN/A$ 15.50N/A$ 24.25$ 18.00N/AN/A5.8%N/A9.3%21.1%Bulk WarehouseManufacturingHigh Tech/R&DRETAIL$ 3.00N/AN/A$ 6.00N/AN/A$ 4.50N/AN/A5.0%N/AN/ADowntownNeighborhood Service CentersCommunity Power CenterRegional Malls$ 14.00N/AN/AN/A$ 18.00N/AN/AN/A$ 16.50N/AN/AN/A9.5%N/AN/AN/ADEVELOPMENT LAND Low/Acre High/AcreOffice in CBDLand in Office ParksLand in Industrial ParksOffice/Industrial Land - Non-parkRetail/<strong>Commercial</strong> LandResidential$$$$$$250,000.00250,000.0025,000.0025,000.00250,000.0020,000.00$$$$$$400,000.00400,000.0045,000.0045,000.00625,000.00105,000.00Albany At A Glance(Rent/SF/YR) Low High Effective Avg. VacancyDOWNTOWN OFFICENew Construction (AAA)Class A (Prime)Class B (Secondary)SUBURBAN OFFICENew Construction (AAA)Class A (Prime)Class B (Secondary)INDUSTRIALBulk WarehouseManufacturingHigh Tech/R&DRETAILDowntownNeighborhood Service CentersCommunity Power CenterRegional Malls$$$$$$$$$$$$$22.0018.0012.0016.5016.0011.003.005.509.509.0012.0012.0018.00$$$$$$$$$$$$$26.0024.0016.0022.5020.0016.003.007.5011.5018.0016.0018.0035.00$$$$$$$$$$$$$24.0021.0014.0020.0018.0014.002.755.5510.5013.5014.5015.0026.50N/A5.0%29.0%N/A5.0%14.0%15.0%12.0%10.0%N/AN/AN/AN/ADEVELOPMENT LAND Low/Acre High/AcreOffice in CBDLand in Office ParksLand in Industrial ParksOffice/Industrial Land - Non-parkRetail/<strong>Commercial</strong> LandResidential$$$$$$150,000.00150,000.0075,000.0060,000.00150,000.0025,000.00$$$$$$750,000.00250,000.00175,000.00150,000.00850,000.00125,000.00<strong>2010</strong> <strong>Global</strong> <strong>Market</strong> <strong>Report</strong> ■ www.naiglobal.com 109
New York City, New YorkLong Island, New YorkContact<strong>NAI</strong> <strong>Global</strong> New York City+1 212 405 2500Metropolitan AreaEconomic Overview2008Population2013 EstimatedPopulationEmploymentPopulationHouseholdAverage IncomeMedianHousehold IncomeTotal PopulationMedian Age18,962,01919,340,1769,120,649$89,679$62,06538The Manhattan office market was relatively stable at the endof 2009. The 11.9% vacancy reached in Q3 2009 was thehighest Manhattan has seen in four years, but is still amongthe lowest in the country. Rents continued to decline in 2009with average asking rents falling to $52.05/SF, down fromalmost $70.00/SF in late 2008. However, the rate of declinehas stabilized. Sublease space, which had increased eachquarter for over a year, has also stabilized. Most of the recentleasing activity has been led by those companies waiting forrents to hit bottom and finally deciding to make a move toupgrade their existing space at rock bottom prices.Midtown Manhattan enjoys a great diversity of tenants, andthere are several large tenants seeking space in the200,000+ SF range. Tenants with good credit will continueto have the upper hand with landlords offering increasedconcessions. The Midtown South submarket provides secondaryoffice buildings for tenants seeking less expensivealternatives. Downtown Manhattan is bracing for an increasein available space; however, city government is expandingincentives for services companies locating to the area.Manhattan market fundamentals remain weak with currentunemployment at 10.3%, the highest in New York City in 16years. The financial industry continues to reduce its laborforce, job growth and corporate revenues remain stagnantand the credit market remains tight. With the fundamentalsshowing continued weakness, a turnaround in the commercialmarket is not expected until mid to late <strong>2010</strong>.Investment sales in Manhattan have been few; howeverdistressed assets are starting to appear in greater numberand it is expected that foreign investors and well capitalizedinvestment groups will seek to take advantage of a newpricing structure, spurring the expected turnaround. Thestabilization of sublet space is another indication that themarket may soon turn around as it indicates firms are holdingonto space for anticipated staffing needs, rather than puttingit on the market at a loss and then having to lease additionalspace at a premium once the market has recovered.There are many positive signs, including a strong workforce,New York City’s global leadership and its diverse industriessuch as: Professional Services, Bioscience, Emerging Technology,Green Industry, Media & Entertainment, Not ForProfit, Fashion and Tourism.Contact<strong>NAI</strong> Long Island+1 631 270 3000Metropolitan AreaEconomic Overview2009Population2014 EstimatedPopulationEmploymentPopulationHouseholdAverage IncomeMedianHousehold IncomeTotal PopulationMedian Age1,267,44411,173,752630,791$119,517$91,44542.1As with most of the country, Long Island is feeling the effectsof the recession. History has shown the local economy tobe stable compared to the rest of the nation, in good timesand bad, as evidenced by the current unemployment rateof 7.4%, well below the national average. However, allsegments of the real estate market are soft and it isexpected to worsen before it improves.The office market has weakened considerably throughout2009. Overall vacancy rates for Class A and B space haveincreased to 11.1%. However, the total availability rate,which accounts for occupied sublet space, has increasedto 17.5%. Landlords are offering substantial rent reductionsand concessions to attract and retain tenants.The investment market has changed rapidly in 2009. Thelack of credit has caused investment sales to come to avirtual standstill with few deals being completed. Many propertiespurchased at top prices in recent years are strugglingto meet debt service. Attention has turned to lenders whoare holding numerous loans in early stages of default.The industrial sector is also very soft. Vacancy rates haverisen to 9% but numerous owner occupants have beenstruggling to sell properties too large for their businessesas sales prices have fallen 20-30% in most submarkets.The retail market has been impacted substantially by therecession. Many auto dealerships have lost their licenses,putting quality properties on the market. That increasedinventory has led to a significant reduction of prices forpotential development sites. Home Depot Expo and CircuitCity have left the market, leaving several big box vacancies.Most of these spaces have not been filled but they arebeing considered by retailers looking to take advantage ofthe opportunities.Unlike the recession of the early 1990s, Long Island is notoverbuilt. Because of this, prevailing sentiment is that therecovery from this downturn may be faster than the recoveryin the mid 90s.New York City At A Glance(Rent/SF/YR) Low High Effective Avg. VacancyMIDTOWN OFFICENew Construction (AAA)$ 110.00 $ 185.00 $ 150.00 N/AClass A (Prime)$ 80.00 $ 225.00 $ 100.00 7.2%Class B (Secondary)DOWNTOWN OFFICENew Construction (AAA)Class A (Prime)Class B (Secondary)INDUSTRIALBulk WarehouseManufacturingHigh Tech/R&DRETAIL (Midtown)$$$$38.0065.0040.0025.00N/AN/AN/A$$$$65.0075.0065.0045.00N/AN/AN/A$$$$52.0070.0052.5035.00N/AN/AN/A6.5%N/A6.4%8.2%N/AN/AN/ACentral Business DistrictNeighborhood Service CentersCommunity Power CenterRegional Malls$ 60.00N/AN/AN/A$1,400.00N/AN/AN/A$ 300.00N/AN/AN/A3.5%N/AN/AN/ADEVELOPMENT LAND Low/Acre High/AcreOffice in CBDLand in Office ParksLand in Industrial ParksOffice/Industrial Land - Non-parkRetail/<strong>Commercial</strong> LandResidentialN/AN/AN/AN/AN/AN/AN/AN/AN/AN/AN/AN/ALong Island At A Glance(Rent/SF/YR) Low High Effective Avg. VacancyDOWNTOWN OFFICENew Construction (AAA)Class A (Prime)Class B (Secondary)SUBURBAN OFFICENew Construction (AAA)Class A (Prime)Class B (Secondary)INDUSTRIALBulk WarehouseManufacturingHigh Tech/R&DRETAILDowntownNeighborhood Service CentersCommunity Power Center$$$$$$$N/AN/AN/A30.0028.0022.004.50N/A14.00N/A18.0020.00$$$$$$$N/AN/AN/A36.0034.0028.007.00N/A18.00N/A30.0040.00N/AN/AN/AN/AN/AN/AN/AN/AN/AN/AN/AN/AN/AN/AN/A11.0%11.0%11.0%9.0%9.0%8.5%N/AN/AN/ARegional Malls$ 60.00 $ 120.00 N/A N/ADEVELOPMENT LAND Low/Acre High/AcreOffice in CBDLand in Office Parks$N/A500,000.00N/A$ 1,000,000.00Land in Industrial Parks$ 300,000.00 $ 600,000.00Office/Industrial Land - Non-parkRetail/<strong>Commercial</strong> LandResidential$$500,000.00800,000.00N/A$ 1,000,000.00$ 2,500,000.00N/A<strong>2010</strong> <strong>Global</strong> <strong>Market</strong> <strong>Report</strong> ■ www.naiglobal.com 110
- Page 1 and 2:
CommercialCommercial Real Estate Se
- Page 3 and 4:
■ ■ ■ Table of ContentsGENERA
- Page 5 and 6:
Global OutlookCommercial real estat
- Page 7 and 8:
38.3% in November 2009. At the same
- Page 9 and 10:
quality than the Census properties.
- Page 11 and 12:
SaskatchewanSaskatchewan is a small
- Page 13 and 14:
As 2009 draws to a close, there is
- Page 15 and 16:
Global investment interest largely
- Page 18 and 19:
ChinaChina continued to post large
- Page 20 and 21:
MalaysiaWith Malaysia’s dependenc
- Page 22 and 23:
■ US Highlights - Northeast Regio
- Page 24 and 25:
■ US Highlights - Midwest Region
- Page 26 and 27:
■ US Highlights - West Region■
- Page 28 and 29:
Melbourne, AustraliaBeijing, ChinaC
- Page 30 and 31:
Shanghai, ChinaXiamen, ChinaContact
- Page 32 and 33:
Delhi, Gurgaon, IndiaHyderabad, Pra
- Page 34 and 35:
Punjab, IndiaTokyo, JapanContactNAI
- Page 36 and 37:
Seoul, South KoreaTaipei, TaiwanCon
- Page 38 and 39:
Calgary, Alberta, CanadaEdmonton, A
- Page 40 and 41:
Halifax, Nova Scotia, CanadaOttawa,
- Page 42 and 43:
Regina, Saskatchewan, CanadaContact
- Page 44 and 45:
Vienna, AustriaThe Baltics (Latvia/
- Page 46 and 47:
Copenhagen, DenmarkFinlandContactNA
- Page 48 and 49:
Athens, GreeceReykjavik IcelandCont
- Page 50 and 51:
KuwaitOslo, NorwayContactNAI Kuwait
- Page 52 and 53:
Moscow, Russian FederationSt. Peter
- Page 54 and 55:
Madrid, SpainStockholm, SwedenConta
- Page 56 and 57:
Istanbul, TurkeyKiev, UkraineContac
- Page 58 and 59:
Latin AmericaSECTION CONTENTSBuenos
- Page 60 and 61: Campinas, BrazilCuritiba, BrazilCon
- Page 62 and 63: Sao Paulo, BrazilSantiago, ChileCon
- Page 64 and 65: Ciudad Juarez, Chihuahua, MexicoGua
- Page 66 and 67: Matamoros, Tamaulipas, MexicoMexica
- Page 68 and 69: Reynosa, MexicoSaltillo, Coahuila,
- Page 70 and 71: Torreon, Coahulia, MexicoCaracas, V
- Page 72 and 73: Birmingham, AlabamaHuntsville, Deca
- Page 74 and 75: Jonesboro, ArkansasLittle Rock, Ark
- Page 76 and 77: Marin County, CaliforniaMonterey, C
- Page 78 and 79: Sacramento, CaliforniaSan Diego, Ca
- Page 80 and 81: Santa Clara County (Silicon Valley)
- Page 82 and 83: Colorado Springs, ColoradoDenver, C
- Page 84 and 85: Fort Lauderdale, FloridaFt. Myers/N
- Page 86 and 87: Miami, FloridaOrlando, FloridaConta
- Page 88 and 89: Atlanta, GeorgiaHonolulu, HawaiiCon
- Page 90 and 91: Chicago, IllinoisSpringfield, Illin
- Page 92 and 93: Cedar Rapids, Iowa City, IowaDavenp
- Page 94 and 95: Wichita, KansasLexington, KentuckyC
- Page 96 and 97: Monroe, LouisianaNew Orleans, Louis
- Page 98 and 99: Suburban MarylandBoston, Massachuse
- Page 100 and 101: Grand Rapids, MichiganLansing, Mich
- Page 102 and 103: St. Louis, MissouriBozeman, Montana
- Page 104 and 105: Omaha, NebraskaLas Vegas, NevadaCon
- Page 106 and 107: Portsmouth, New HampshireAtlantic C
- Page 108 and 109: Ocean/Monmouth Counties (“Shore M
- Page 112 and 113: Asheville, North CarolinaCharlotte,
- Page 114 and 115: Fargo, North DakotaAkron, OhioConta
- Page 116 and 117: Cleveland, OhioColumbus, OhioContac
- Page 118 and 119: Tulsa, OklahomaPortland, OregonCont
- Page 120 and 121: Bucks County, PennsylvaniaHarrisbur
- Page 122 and 123: Pittsburgh, PennsylvaniaSchuylkill
- Page 124 and 125: Greenville/Spartanburg/Anderson Cou
- Page 126 and 127: Knoxville, TennesseeMemphis, Tennes
- Page 128 and 129: Beaumont, TexasCorpus Christi, Texa
- Page 130 and 131: Fort Worth, TexasHouston, TexasCont
- Page 132 and 133: Texarkana (Bowie County, Texas/Mill
- Page 134 and 135: Northern VirginiaSeattle/Puget Soun
- Page 136 and 137: Madison, WisconsinMilwaukee, Wiscon
- Page 138 and 139: Jackson Hole, WyomingContactNAI Jac
- Page 140: Build on the power of our network.N


