Texarkana (Bowie County, Texas/Miller County, Arkansas), TexasSalt Lake City, UtahContact<strong>NAI</strong> American <strong>Real</strong>ty Co.+1 903 793 2666Metropolitan AreaEconomic Overview2009Population2014 EstimatedPopulationEmploymentPopulationHouseholdAverage Income134,117133,36561,861$57,074Forbes Magazine predicted Texarkana to be ranked numbertwo in the US for the fastest growing SMSA in the under500,000 category, with a 28.57% increase in gross metropolitanproduct over the next five years. Transportation,medical, industrial and residential growth continues with anincreased vacancy rate in the retail sector.The medical office sector has experienced moderate growthas Texarkana continues to be the regional center for thesurrounding 60-mile area. The purchase of Wadley RegionalHospital by Brim Heathcare insures robust competition andgrowth in the industry.The industrial base for the market is diverse, with two papermills, Cooper Tire and Red River Army Depot the leadingemployers. The Depot is expected to transfer several thousandacres with buildings and infrastructure to Red RiverRedevelopment Authority in the near future. Constructionis under way for a new clean burning coal power plant,resulting in 1,000 construction jobs, and a new cementplant is in progress. Alumax Aluminum mill closed, butCooper Tire expanded in Texarkana after closing its Anniston,Alabama, plant.Texarkana continued to experience reduced growth in theretail sector in 2009. However, Lafferty’s Appliance, OsakaJapanese Restaurant, and Minton’s Sportsplex all opened,providing a bright spot for this market. Central Mall hasadded several small shops and maintains a high occupancyrate. Recent hotel openings include Holiday Inn Express,Best Western, Fairfield and Candlewood Suites with aHoliday Inn, Country Host, Crown Plaza and Sleep Inn,scheduled to open soon. A new convention center, hotel andrestaurant are planned on the Arkansas side of TexarkanaWe anticipate additional retail, hospitality and restaurantgrowth in this area. Texas A&M University has completedconstruction of a new science and technology building andconstruction has begun on a new 183,000 SF library buildingthat is a part of the 375-acre 1.4 million SF University.Contact<strong>NAI</strong> Utah <strong>Commercial</strong><strong>Real</strong> <strong>Estate</strong> (Salt Lake)+1 801 578 5555Metropolitan AreaEconomic Overview2009Population2014 EstimatedPopulationEmploymentPopulationHouseholdAverage Income1,163,8451,324,171650,512$72,391Salt Lake City is a vibrant, pro-business community with ahighly educated populace and an entrepreneurial spirit thatis consistently rated among the best cities for business.Healthcare, technology and education remain the primarydrivers of the local economy. Unemployment is a relativelylow 6.1% compared to the national average. Salt Lake Citycontinues to outperform the nation as a whole and remainsone of the soundest economies in the US.The commercial real estate industry in the Salt Lake Citymetropolitan market trended downward in 2009 in responseto the changing economic conditions. The total office marketinventory is 31.5 million SF, one-third of which lies in thedowntown submarket. Direct vacancy in the overall marketincreased to 13.6%; vacancy downtown is 5.8% and 17.8%in the suburban submarkets. Class A full service rental rateshave dipped to an average of $25/SF for product downtownand an average of $22/SF for office space in the suburbansubmarkets. While leasing activity is down compared to2008, it has improved steadily through the year.Salt Lake City is a key distribution hub with over 109 millionSF of industrial space. Total availability in the industrialmarket reached 9% this year after bottoming at 4% in late2007. Lease rates have declined 7% since late 2008 andaverage at $.40/SF NNN per month. While leasing activityhas leveled off this year, a 470,000 SF distributionwarehouse was sold midyear. The retail market has justunder 37 million SF of leasable space. Vacancy in the overallmarket stands at 6%. Rates have dipped to $15/SF NNN inthe CBD.Salt Lake City’s largest project is the City Creek Centermixed-use redevelopment in the CBD. The 20-acre developmentincludes 1.5 million SF of office space, 800,000 SF ofretail space, 700 residential units and large swaths of openspaces. The development is scheduled for completion in2012.MedianHousehold Income$41,098MedianHousehold Income$62,526Total PopulationMedian Age38Total PopulationMedian Age31Texarkana At A Glance(Rent/SF/YR) Low High Effective Avg. VacancyDOWNTOWN OFFICENew Construction (AAA)Class A (Prime)Class B (Secondary)SUBURBAN OFFICENew Construction (AAA)Class A (Prime)Class B (Secondary)INDUSTRIALBulk WarehouseManufacturingHigh Tech/R&DRETAILDowntownNeighborhood Service CentersSub Regional CentersRegional Malls$$$$$$$$$$$$N/A10.505.5012.0013.008.002.002.5013.004.007.007.006.00$$$$$$$$$$$N/A12.509.5018.0017.0011.003.504.5016.0011.0016.0018.00N/A$$$$$$$$$$$$N/A11.507.5014.0015.009.502.252.7514.507.5011.5012.5018.50N/A20.0%85.0%5.0%5.0%7.0%15.0%20.0%0.0%15.0%10.0%10.0%8.0%DEVELOPMENT LAND Low/Acre High/AcreOffice in CBDLand in Office ParksLand in Industrial ParksOffice/Industrial Land - Non-parkRetail/<strong>Commercial</strong> LandResidential$$$$$$25,000.00185,000.0010,000.0010,000.00200,000.0014,000.00$$$$$$175,000.00250,000.0030,000.0025,000.00650,000.0070,000.00Salt Lake City At A Glance(Rent/SF/YR) Low High Effective Avg. VacancyDOWNTOWN OFFICENew Construction (AAA)Class A (Prime)Class B (Secondary)SUBURBAN OFFICENew Construction (AAA)Class A (Prime)Class B (Secondary)INDUSTRIAL$$$$$$33.0022.0812.5018.7517.5017.50$$$$$$33.0028.0022.0024.0028.0022.00$ 33.00$ 24.51$ 17.73$ 21.38$ 22.20$ 18.5867.0%5.8%17.8%73.6%14.9%17.6%Bulk WarehouseManufacturingHigh Tech/R&DRETAIL$$$2.883.002.88$$$6.0012.9616.08$$$4.205.406.72N/AN/AN/ADowntownNeighborhood Service CentersCommunity Power CenterRegional Malls$$$$6.7510.8215.7728.50$$$$23.4029.1230.5337.20$ 15.23$ 16.88$ 23.77$ 32.85N/AN/AN/AN/ADEVELOPMENT LAND Low/Acre High/AcreOffice in CBDLand in Office ParksLand in Industrial ParksOffice/Industrial Land - Non-park$$N/A239,017.0085,665.00N/A$$N/A239,017.00565,789.00N/ARetail/<strong>Commercial</strong> LandResidential$ 379,310.00N/A$ 1,176,120.00N/A<strong>2010</strong> <strong>Global</strong> <strong>Market</strong> <strong>Report</strong> ■ www.naiglobal.com 131
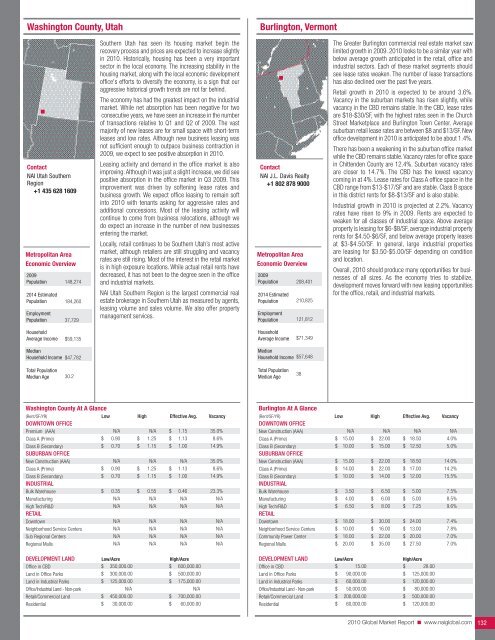
Washington County, UtahBurlington, VermontContact<strong>NAI</strong> Utah SouthernRegion+1 435 628 1609Metropolitan AreaEconomic Overview2009Population2014 EstimatedPopulationEmploymentPopulation148,274184,26037,729Southern Utah has seen its housing market begin therecovery process and prices are expected to increase slightlyin <strong>2010</strong>. Historically, housing has been a very importantsector in the local economy. The increasing stability in thehousing market, along with the local economic developmentoffice's efforts to diversify the economy, is a sign that ouraggressive historical growth trends are not far behind.The economy has had the greatest impact on the industrialmarket. While net absorption has been negative for twoconsecutive years, we have seen an increase in the numberof transactions relative to Q1 and Q2 of 2009. The vastmajority of new leases are for small space with short-termleases and low rates. Although new business leasing wasnot sufficient enough to outpace business contraction in2009, we expect to see positive absorption in <strong>2010</strong>.Leasing activity and demand in the office market is alsoimproving. Although it was just a slight increase, we did seepositive absorption in the office market in Q3 2009. Thisimprovement was driven by softening lease rates andbusiness growth. We expect office leasing to remain softinto <strong>2010</strong> with tenants asking for aggressive rates andadditional concessions. Most of the leasing activity willcontinue to come from business relocations, although wedo expect an increase in the number of new businessesentering the market.Locally, retail continues to be Southern Utah’s most activemarket, although retailers are still struggling and vacancyrates are still rising. Most of the interest in the retail marketis in high exposure locations. While actual retail rents havedecreased, it has not been to the degree seen in the officeand industrial markets.<strong>NAI</strong> Utah Southern Region is the largest commercial realestate brokerage in Southern Utah as measured by agents,leasing volume and sales volume. We also offer propertymanagement services.Contact<strong>NAI</strong> J.L. Davis <strong>Real</strong>ty+1 802 878 9000Metropolitan AreaEconomic Overview2009Population2014 EstimatedPopulationEmploymentPopulation208,401210,825121,812The Greater Burlington commercial real estate market sawlimited growth in 2009. <strong>2010</strong> looks to be a similar year withbelow average growth anticipated in the retail, office andindustrial sectors. Each of these market segments shouldsee lease rates weaken. The number of lease transactionshas also declined over the past five years.Retail growth in <strong>2010</strong> is expected to be around 3.6%.Vacancy in the suburban markets has risen slightly, whilevacancy in the CBD remains stable. In the CBD, lease ratesare $18-$30/SF, with the highest rates seen in the ChurchStreet <strong>Market</strong>place and Burlington Town Center. Averagesuburban retail lease rates are between $8 and $13/SF. Newoffice development in <strong>2010</strong> is anticipated to be about 1.4%.There has been a weakening in the suburban office marketwhile the CBD remains stable. Vacancy rates for office spacein Chittenden County are 12.4%. Suburban vacancy ratesare closer to 14.7%. The CBD has the lowest vacancycoming in at 4%. Lease rates for Class A office space in theCBD range from $13-$17/SF and are stable. Class B spacein this district rents for $8-$13/SF and is also stable.Industrial growth in <strong>2010</strong> is projected at 2.2%. Vacancyrates have risen to 9% in 2009. Rents are expected toweaken for all classes of industrial space. Above averageproperty is leasing for $6-$8/SF, average industrial propertyrents for $4.50-$6/SF, and below average property leasesat $3-$4.50/SF. In general, large industrial propertiesare leasing for $3.50-$5.00/SF depending on conditionand location.Overall, <strong>2010</strong> should produce many opportunities for businessesof all sizes. As the economy tries to stabilize,development moves forward with new leasing opportunitiesfor the office, retail, and industrial markets.HouseholdAverage Income$59,135HouseholdAverage Income$71,349MedianHousehold Income$47,782MedianHousehold Income$57,648Total PopulationMedian Age30.2Total PopulationMedian Age38Washington County At A Glance(Rent/SF/YR) Low High Effective Avg. VacancyDOWNTOWN OFFICEPremium (AAA)Class A (Prime)Class B (Secondary)SUBURBAN OFFICENew Construction (AAA)Class A (Prime)Class B (Secondary)INDUSTRIALBulk WarehouseManufacturingHigh Tech/R&DRETAILDowntownNeighborhood Service CentersSub Regional CentersRegional Malls$$$$$N/A0.900.70N/A0.900.700.35N/AN/AN/AN/AN/AN/A$$$$$N/A1.251.15N/A1.251.150.55N/AN/AN/AN/AN/AN/A$$$$$$1.151.131.00N/A1.131.000.46N/AN/AN/AN/AN/AN/A35.0%8.6%14.9%35.0%8.6%14.9%23.3%N/AN/AN/AN/AN/AN/ADEVELOPMENT LAND Low/Acre High/AcreOffice in CBDLand in Office ParksLand in Industrial ParksOffice/Industrial Land - Non-parkRetail/<strong>Commercial</strong> LandResidential$$$$$350,000.00300,000.00125,000.00N/A450,000.0030,000.00$$$$$600,000.00500,000.00175,000.00N/A700,000.0060,000.00Burlington At A Glance(Rent/SF/YR) Low High Effective Avg. VacancyDOWNTOWN OFFICENew Construction (AAA)Class A (Prime)Class B (Secondary)SUBURBAN OFFICENew Construction (AAA)Class A (Prime)Class B (Secondary)INDUSTRIALBulk WarehouseManufacturingHigh Tech/R&DRETAILDowntownNeighborhood Service CentersCommunity Power CenterRegional Malls$$$$$$$$$$$$N/A15.0010.0015.0014.0010.003.504.006.5018.0010.0018.0020.00$$$$$$$$$$$$N/A22.0015.0022.0022.0014.006.506.008.0030.0016.0022.0035.00$$$$$$$$$$$$N/A18.5012.5018.5017.0012.005.005.007.2524.0013.0020.0027.50N/A4.0%5.0%14.0%14.2%15.5%7.5%8.5%9.6%7.4%7.8%7.0%7.0%DEVELOPMENT LAND Low/Acre High/AcreOffice in CBD$ 15.00 $ 28.00Land in Office ParksLand in Industrial ParksOffice/Industrial Land - Non-parkRetail/<strong>Commercial</strong> LandResidential$$$$$90,000.0060,000.0050,000.00200,000.0060,000.00$$$$$125,000.00120,000.0080,000.00500,000.00120,000.00<strong>2010</strong> <strong>Global</strong> <strong>Market</strong> <strong>Report</strong> ■ www.naiglobal.com 132
- Page 1 and 2:
CommercialCommercial Real Estate Se
- Page 3 and 4:
■ ■ ■ Table of ContentsGENERA
- Page 5 and 6:
Global OutlookCommercial real estat
- Page 7 and 8:
38.3% in November 2009. At the same
- Page 9 and 10:
quality than the Census properties.
- Page 11 and 12:
SaskatchewanSaskatchewan is a small
- Page 13 and 14:
As 2009 draws to a close, there is
- Page 15 and 16:
Global investment interest largely
- Page 18 and 19:
ChinaChina continued to post large
- Page 20 and 21:
MalaysiaWith Malaysia’s dependenc
- Page 22 and 23:
■ US Highlights - Northeast Regio
- Page 24 and 25:
■ US Highlights - Midwest Region
- Page 26 and 27:
■ US Highlights - West Region■
- Page 28 and 29:
Melbourne, AustraliaBeijing, ChinaC
- Page 30 and 31:
Shanghai, ChinaXiamen, ChinaContact
- Page 32 and 33:
Delhi, Gurgaon, IndiaHyderabad, Pra
- Page 34 and 35:
Punjab, IndiaTokyo, JapanContactNAI
- Page 36 and 37:
Seoul, South KoreaTaipei, TaiwanCon
- Page 38 and 39:
Calgary, Alberta, CanadaEdmonton, A
- Page 40 and 41:
Halifax, Nova Scotia, CanadaOttawa,
- Page 42 and 43:
Regina, Saskatchewan, CanadaContact
- Page 44 and 45:
Vienna, AustriaThe Baltics (Latvia/
- Page 46 and 47:
Copenhagen, DenmarkFinlandContactNA
- Page 48 and 49:
Athens, GreeceReykjavik IcelandCont
- Page 50 and 51:
KuwaitOslo, NorwayContactNAI Kuwait
- Page 52 and 53:
Moscow, Russian FederationSt. Peter
- Page 54 and 55:
Madrid, SpainStockholm, SwedenConta
- Page 56 and 57:
Istanbul, TurkeyKiev, UkraineContac
- Page 58 and 59:
Latin AmericaSECTION CONTENTSBuenos
- Page 60 and 61:
Campinas, BrazilCuritiba, BrazilCon
- Page 62 and 63:
Sao Paulo, BrazilSantiago, ChileCon
- Page 64 and 65:
Ciudad Juarez, Chihuahua, MexicoGua
- Page 66 and 67:
Matamoros, Tamaulipas, MexicoMexica
- Page 68 and 69:
Reynosa, MexicoSaltillo, Coahuila,
- Page 70 and 71:
Torreon, Coahulia, MexicoCaracas, V
- Page 72 and 73:
Birmingham, AlabamaHuntsville, Deca
- Page 74 and 75:
Jonesboro, ArkansasLittle Rock, Ark
- Page 76 and 77:
Marin County, CaliforniaMonterey, C
- Page 78 and 79:
Sacramento, CaliforniaSan Diego, Ca
- Page 80 and 81:
Santa Clara County (Silicon Valley)
- Page 82 and 83: Colorado Springs, ColoradoDenver, C
- Page 84 and 85: Fort Lauderdale, FloridaFt. Myers/N
- Page 86 and 87: Miami, FloridaOrlando, FloridaConta
- Page 88 and 89: Atlanta, GeorgiaHonolulu, HawaiiCon
- Page 90 and 91: Chicago, IllinoisSpringfield, Illin
- Page 92 and 93: Cedar Rapids, Iowa City, IowaDavenp
- Page 94 and 95: Wichita, KansasLexington, KentuckyC
- Page 96 and 97: Monroe, LouisianaNew Orleans, Louis
- Page 98 and 99: Suburban MarylandBoston, Massachuse
- Page 100 and 101: Grand Rapids, MichiganLansing, Mich
- Page 102 and 103: St. Louis, MissouriBozeman, Montana
- Page 104 and 105: Omaha, NebraskaLas Vegas, NevadaCon
- Page 106 and 107: Portsmouth, New HampshireAtlantic C
- Page 108 and 109: Ocean/Monmouth Counties (“Shore M
- Page 110 and 111: Las Cruces, New MexicoAlbany, New Y
- Page 112 and 113: Asheville, North CarolinaCharlotte,
- Page 114 and 115: Fargo, North DakotaAkron, OhioConta
- Page 116 and 117: Cleveland, OhioColumbus, OhioContac
- Page 118 and 119: Tulsa, OklahomaPortland, OregonCont
- Page 120 and 121: Bucks County, PennsylvaniaHarrisbur
- Page 122 and 123: Pittsburgh, PennsylvaniaSchuylkill
- Page 124 and 125: Greenville/Spartanburg/Anderson Cou
- Page 126 and 127: Knoxville, TennesseeMemphis, Tennes
- Page 128 and 129: Beaumont, TexasCorpus Christi, Texa
- Page 130 and 131: Fort Worth, TexasHouston, TexasCont
- Page 134 and 135: Northern VirginiaSeattle/Puget Soun
- Page 136 and 137: Madison, WisconsinMilwaukee, Wiscon
- Page 138 and 139: Jackson Hole, WyomingContactNAI Jac
- Page 140: Build on the power of our network.N


