Punjab, IndiaTokyo, JapanContact<strong>NAI</strong> Space Alliance+91 11 55854444Country DataArea (KM 2 )GDP Growth (%)GDP 2009 (US$ B)GDP/Capita (US$)Inflation Rate (%)1334.35.36%$1,242.65$1,032.718.66%The past year in Punjab brought much anxiety as demandin the real estate market fell sharply. The global economicmeltdown and slowing demand, coupled with a liquiditycrisis, resulted in mega projects moving at a snail’s pace.The first half of 2009 was even tougher than 2008as demand across all sectors--commercial, retail andresidential--continued to remain weak. In 2009, almostevery developer had reported a decline in leases and salesin all markets.The office market saw a downward trend with severalcompanies choosing to shut down operations. Even localdevelopers have closed their marketing offices at differentlocations and many deferred their expansion plans, furtherimpacting rates and leading to a drop in rentals by 15%.Major industry in Punjab includes a wide range of productsfrom ready made garments and hosiery to machine toolsand auto parts. This sector has seen a 45% dip in Q3 2009compared to last year.The retail sector also felt the pinch of the economic slowdown.High rentals in up-market locations in Punjab forcedretailers to slow expansion and to shut down unproductivestores. Ludhiana, the industrial town of Punjab and the hubof retail expansion, also showed signs of a slowdown withfewer inquiries from retailers in Q3 2009.The price of residential properties also continued to declinein 2009. Reduced real estate rates, lower interest rates andbetter incentives for customers to purchase homes will goa long way in rebuilding the entire real estate industry. Theremainder of 2009 saw customers who had deferred homepurchases in 2008 take action and purchase homes giventhe affordability of product on the market.Punjab carries good potential for the real estate sector inthe long term. The past year was not excellent for this sectoras there was no demand at all. The impact of the economicslowdown is going to stay for another six months.Contact<strong>NAI</strong> Japan+81 3 5418 8747Country DataArea (KM 2 )GDP Growth (%)GDP 2009 (US$ B)GDP/Capita (US$)Inflation Rate (%)1334.3-5.37%$5,048.63$39,573.49-1.13%With the deepening decline in all sectors in 2009, real estatemarkets in Japan’s key centers of Tokyo and Osaka haveremained in a depressed state. The inability for organizationsto obtain loans, whether new or extensions on alreadyexisting loans, has resulted in many large and small defaultsthat have continued to only worsen an already stagnantsituation. A record number of developers have gone bankruptas lenders refuse to roll-over loans that had previouslybeen readily available with easy terms.Despite this, many sellers have remained quite defiant andthe massive drop in sale prices that many had expected hasnot yet been realized. A relatively large amount of producthas made its way to the market, yet much of it remains atpricing that is not appealing to many potential investors. Theinvestor interest in the Japanese market, particularly inTokyo assets, has risen continually this year with many fundspoised to take advantage of opportunities that offer significantyields.The remainder of 2009 will likely see an increase in transactionsas the gaps between buyer and seller expectationsclose. With the prevailing economic conditions there hasbeen a continuing low demand for rental of office, retail(particularly for medium to high-end imported brands),residential, industrial and hospitality properties. Rents havebeen in a steady decline particularly in the retail and officesectors with terms becoming more and more favorablefor tenants. Class A office rents show evidence of this downwardtrend.Many major office buildings have relatively high levels ofvacancy at 5.5 % for Class A office buildings and 5.8 % forClass B. As a result, after years of absence, free rent periods,on top of already reduced rental rates, have returned tothe market.UnemploymentRate (%)7.32%UnemploymentRate (%)5.4%Interest Rate(%)4.75%Interest Rate(%)0.1%Population (Millions)1203.28Population (Millions) 127.576Punjab At A GlanceConversion: 45 INR = 1 US$ RENT/M 2 /MO US$ RENT/SF/YRLow High Low High VacancyCITY CENTER OFFICENew Construction (AAA)Class A (Prime)Class B (Secondary)SUBURBAN OFFICENew Construction (AAA)Class A (Prime)Class B (Secondary)INDUSTRIALBulk WarehouseManufacturingHigh Tech/R&DRETAILDowntownNeighborhood Service CentersN/AINR 370.00INR 209.00N/AN/AN/AINR 126.00N/AN/AN/AN/AINRINRINRN/A540.00301.00N/AN/AN/A232.00N/AN/AN/AN/A$$$N/A9.175.18N/AN/AN/A3.12N/AN/AN/AN/A$$$N/A13.387.46N/AN/AN/A5.75N/AN/AN/AN/AN/A18.0%16.0%N/AN/AN/A14.0%N/AN/AN/AN/ACommunity Power CenterRegional MallsSolus Food StoresINR 1,088.00INR 1,060.00N/AINR 1,586.00INR 1,836.00N/A$ 26.95$ 26.26N/A$$39.2945.48N/A11.0%15.0%N/ADEVELOPMENT LAND Low/Acre High/Acre Low/Acre High/AcreOffice in CBDLand in Office ParksLand in Industrial ParksOffice/Industrial Land - Non-parkRetail/<strong>Commercial</strong> LandResidentialN/A N/A N/A N/AN/A N/A N/A N/AN/A N/A N/A N/AN/A N/A N/A N/AN/A N/A N/A N/AN/A N/A N/A N/ATokyo At A GlanceConversion:90 JPY = 1 US$ RENT/M 2 /MO US$ RENT/SF/YRLow High Low High VacancyDOWNTOWN OFFICENew Construction (AAA)Class A (Prime)Class B (Secondary)SUBURBAN OFFICENew Construction (AAA)Class A (Prime)Class B (Secondary)INDUSTRIALBulk WarehouseManufacturingHigh Tech/R&DRETAILDowntownNeighborhood Service CentersCommunity Power CenterRegional MallsJPY 6,667.00 JPY 12,727.00 $ 82.58 $ 157.65 N/AJPY 5,455.00 JPY 12,120.00 $ 67.57 $ 150.13 5.5%JPY 3,636.00 JPY 11,515.00 $ 45.04 $ 142.64 5.8%JPY 6,969.00 JPY 8,789.00 $ 86.32 $ 108.87 N/AJPY 4,849.00 JPY 7,273.00 $ 60.06 $ 90.09 10.1%JPY 1,818.00 JPY 6,060.00 $ 22.52 $ 75.07 18.3%JPY 1,045.00 JPY 3,203.00 $ 12.94 $ 39.68 N/AJPY 1,358.00 JPY 2,732.00 $ 16.82 $ 33.84 N/AN/A N/A N/A N/A N/AJPY 5,890.00 JPY 18,023.00 $ 72.96 $ 223.25 N/AJPY 4,385.00 JPY 8,770.00 $ 54.32 $ 108.63 N/AJPY 3,775.00 JPY 7,260.00 $ 46.76 $ 89.93 N/AJPY 1,890.00 JPY 3,500.00 $ 23.41 $ 43.35 N/AN/A N/A N/A N/A N/ADEVELOPMENT LAND Low/SF High/SF Low/SF High/SFOffice in CBDJPY 6,330,000 JPY 67,000,000 $ 70,333.33 $ 744,444.44Land in Office ParksN/A N/A N/A N/ALand in Industrial ParksOffice/Industrial Land - Non-parkJPYJPY330,000 JPY 1,500,000786,000 JPY 5,790,000$$3,666.678,733.33$$16,666.6764,333.33Retail/<strong>Commercial</strong> LandResidential (per M 2 )JPY 1,700,000 JPY 36,340,000JPY 1,300,000 JPY 6,300,000$$18,888.8914,444.44$$403,777.7870,000.00<strong>2010</strong> <strong>Global</strong> <strong>Market</strong> <strong>Report</strong> ■ www.naiglobal.com 33
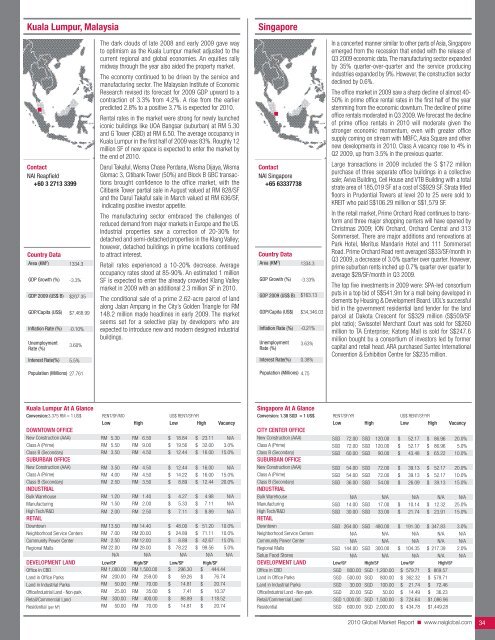
Kuala Lumpur, MalaysiaSingaporeContact<strong>NAI</strong> Reapfield+60 3 2713 3399Country DataArea (KM 2 )GDP Growth (%)GDP 2009 (US$ B)GDP/Capita (US$)Inflation Rate (%)UnemploymentRate (%)Interest Rate(%)1334.3-3.3%$207.35$7,468.99-0.10%3.60%5.5%The dark clouds of late 2008 and early 2009 gave wayto optimism as the Kuala Lumpur market adjusted to thecurrent regional and global economies. An equities rallymidway through the year also aided the property market.The economy continued to be driven by the service andmanufacturing sector. The Malaysian Institute of EconomicResearch revised its forecast for 2009 GDP upward to acontraction of 3.3% from 4.2%. A rise from the earlierpredicted 2.8% to a positive 3.7% is expected for <strong>2010</strong>.Rental rates in the market were strong for newly launchediconic buildings like UOA Bangsar (suburban) at RM 5.30and G Tower (CBD) at RM 6.50. The average occupancy inKuala Lumpur in the first half of 2009 was 83%. Roughly 12million SF of new space is expected to enter the market bythe end of <strong>2010</strong>.Darul Takaful, Wisma Chase Perdana, Wisma Dijaya, WismaGlomac 3, Citibank Tower (50%) and Block B GBC transactionsbrought confidence to the office market, with theCitibank Tower partial sale in August valued at RM 828/SFand the Darul Takaful sale in March valued at RM 636/SF,indicating positive investor appetite.The manufacturing sector embraced the challenges ofreduced demand from major markets in Europe and the US.Industrial properties saw a correction of 20-30% fordetached and semi-detached properties in the Klang Valley;however, detached buildings in prime locations continuedto attract interest.Retail rates experienced a 10-20% decrease. Averageoccupancy rates stood at 85-90%. An estimated 1 millionSF is expected to enter the already crowded Klang Valleymarket in 2009 with an additional 2.3 million SF in <strong>2010</strong>.The conditional sale of a prime 2.62-acre parcel of landalong Jalan Ampang in the City’s Golden Triangle for RM148.2 million made headlines in early 2009. The marketseems set for a selective play by developers who areexpected to introduce new and modern designed industrialbuildings.Contact<strong>NAI</strong> Singapore+65 63337738Country DataArea (KM 2 )GDP Growth (%)GDP 2009 (US$ B)GDP/Capita (US$)Inflation Rate (%)UnemploymentRate (%)Interest Rate(%)1334.3-3.33%$163.13$34,346.03-0.21%3.63%0.38%In a concerted manner similar to other parts of Asia, Singaporeemerged from the recession that ended with the release ofQ3 2009 economic data. The manufacturing sector expandedby 35% quarter-over-quarter and the service producingindustries expanded by 9%. However, the construction sectordeclined by 0.6%.The office market in 2009 saw a sharp decline of almost 40-50% in prime office rental rates in the first half of the yearstemming from the economic downturn. The decline of primeoffice rentals moderated in Q3 2009. We forecast the declineof prime office rentals in <strong>2010</strong> will moderate given thestronger economic momentum, even with greater officesupply coming on stream with MBFC, Asia Square and othernew developments in <strong>2010</strong>. Class A vacancy rose to 4% inQ2 2009, up from 3.5% in the previous quarter.Large transactions in 2009 included the S $172 millionpurchase of three separate office buildings in a collectivesale; Aviva Building, Ceil House and VTB Building with a totalstrate area of 185,019 SF at a cost of S$929 SF. Strata titledfloors in Prudential Towers at level 20 to 25 were sold toKREIT who paid S$106.29 million or S$1,579 SF.In the retail market, Prime Orchard Road continues to transformand three major shopping centers will have opened byChristmas 2009; ION Orchard, Orchard Central and 313Sommerset. There are major additions and renovations atPark Hotel, Meritus Mandarin Hotel and 111 SommersetRoad. Prime Orchard Road rent averaged S$33/SF/month inQ3 2009, a decrease of 3.0% quarter over quarter. However,prime suburban rents inched up 0.7% quarter over quarter toaverage $28/SF/month in Q3 2009.The top five investments in 2009 were: SPA-led consortiumputs in a top bid of S$541.9m for a mall being developed inclements by Housing & Development Board. UOL’s successfulbid in the government residential land tender for the landparcel at Dakota Crescent for S$329 million (S$509/SFplot ratio); Swissotel Merchant Court was sold for S$260million to TA Enterprise; Katong Mall is sold for S$247.6million bought bu a consortium of investors led by formercapital and retail head. ARA purchased Suntec InternationalConvention & Exhibition Centre for S$235 million.Population (Millions) 27.761Population (Millions) 4.75Kuala Lumpur At A GlanceConversion:3.375 RM = 1 US$ RENT/SF/MO US$ RENT/SF/YRLow High Low High VacancyDOWNTOWN OFFICENew Construction (AAA)Class A (Prime)Class B (Secondary)SUBURBAN OFFICENew Construction (AAA)Class A (Prime)Class B (Secondary)INDUSTRIALBulk WarehouseManufacturingHigh Tech/R&DRETAILDowntownNeighborhood Service CentersCommunity Power CenterRegional MallsRM 5.30 RM 6.50 $ 18.84 $ 23.11 N/ARM 5.50 RM 9.00 $ 19.56 $ 32.00 3.0%RM 3.50 RM 4.50 $ 12.44 $ 16.00 15.0%RM 3.50 RM 4.50 $ 12.44 $ 16.00 N/ARM 4.00 RM 4.50 $ 14.22 $ 16.00 15.0%RM 2.50 RM 3.50 $ 8.89 $ 12.44 20.0%RM 1.20 RM 1.40 $ 4.27 $ 4.98 N/ARM 1.50 RM 2.00 $ 5.33 $ 7.11 N/ARM 2.00 RM 2.50 $ 7.11 $ 8.89 N/ARM 13.50 RM 14.40 $ 48.00 $ 51.20 10.0%RM 7.00 RM 20.00 $ 24.89 $ 71.11 10.0%RM 2.50 RM 12.00 $ 8.89 $ 42.67 15.0%RM 22.00 RM 28.00 $ 78.22 $ 99.56 5.0%N/A N/A N/A N/A N/ADEVELOPMENT LAND Low/SF High/SF Low/SF High/SFOffice in CBDRM 1,000.00 RM 1,500.00 $ 296.30 $ 444.44Land in Office ParksLand in Industrial ParksOffice/Industrial Land - Non-parkRMRMRM200.0050.0025.00RMRMRM259.0070.0035.00$$$59.2614.817.41$$$76.7420.7410.37Retail/<strong>Commercial</strong> LandRM 300.00 RM 400.00 $ 88.89 $ 118.52Residential (per M 2 )RM 50.00 RM 70.00 $ 14.81 $ 20.74Singapore At A GlanceConversion: 1.38 SGD = 1 US$ RENT/SF/YR US$ RENT/SF/YRLow High Low High VacancyCITY CENTER OFFICENew Construction (AAA)Class A (Prime)Class B (Secondary)SUBURBAN OFFICENew Construction (AAA)Class A (Prime)Class B (Secondary)INDUSTRIALBulk WarehouseManufacturingHigh Tech/R&DRETAILSGDSGDSGDSGDSGDSGDSGDSGD72.0072.0060.0054.0054.0036.00N/A14.0030.00SGDSGDSGDSGDSGDSGDSGDSGD120.00120.0090.0072.0072.0054.00N/A17.0033.00$$$$$$$$52.1752.1743.4839.1339.1326.09N/A10.1421.74$$$$$$$$86.9686.9665.2252.1752.1739.13N/A12.3223.9120.0%5.0%10.0%20.0%10.0%15.0%N/A25.0%15.0%DowntownSGD 264.00 SGD 480.00 $ 191.30 $ 347.83 3.0%Neighborhood Service CentersCommunity Power CenterN/AN/AN/AN/AN/AN/AN/AN/AN/AN/ARegional MallsSGD 144.00 SGD 300.00 $ 104.35 $ 217.39 2.0%Solus Food StoresN/A N/A N/A N/A N/ADEVELOPMENT LAND Low/SF High/SF Low/SF High/SFOffice in CBDLand in Office ParksLand in Industrial ParksOffice/Industrial Land - Non-parkRetail/<strong>Commercial</strong> LandResidentialSGD 800.00 SGD 1,200.00 $ 579.71 $ 869.57SGD 500.00 SGD 800.00 $ 362.32 $ 579.71SGD 30.00 SGD 100.00 $ 21.74 $ 72.46SGD 20.00 SGD 50.00 $ 14.49 $ 36.23SGD 1,000.00 SGD 1,500.00 $ 724.64 $1,086.96SGD 600.00 SGD 2,000.00 $ 434.78 $1,449.28<strong>2010</strong> <strong>Global</strong> <strong>Market</strong> <strong>Report</strong> ■ www.naiglobal.com 34
- Page 1 and 2: CommercialCommercial Real Estate Se
- Page 3 and 4: ■ ■ ■ Table of ContentsGENERA
- Page 5 and 6: Global OutlookCommercial real estat
- Page 7 and 8: 38.3% in November 2009. At the same
- Page 9 and 10: quality than the Census properties.
- Page 11 and 12: SaskatchewanSaskatchewan is a small
- Page 13 and 14: As 2009 draws to a close, there is
- Page 15 and 16: Global investment interest largely
- Page 18 and 19: ChinaChina continued to post large
- Page 20 and 21: MalaysiaWith Malaysia’s dependenc
- Page 22 and 23: ■ US Highlights - Northeast Regio
- Page 24 and 25: ■ US Highlights - Midwest Region
- Page 26 and 27: ■ US Highlights - West Region■
- Page 28 and 29: Melbourne, AustraliaBeijing, ChinaC
- Page 30 and 31: Shanghai, ChinaXiamen, ChinaContact
- Page 32 and 33: Delhi, Gurgaon, IndiaHyderabad, Pra
- Page 36 and 37: Seoul, South KoreaTaipei, TaiwanCon
- Page 38 and 39: Calgary, Alberta, CanadaEdmonton, A
- Page 40 and 41: Halifax, Nova Scotia, CanadaOttawa,
- Page 42 and 43: Regina, Saskatchewan, CanadaContact
- Page 44 and 45: Vienna, AustriaThe Baltics (Latvia/
- Page 46 and 47: Copenhagen, DenmarkFinlandContactNA
- Page 48 and 49: Athens, GreeceReykjavik IcelandCont
- Page 50 and 51: KuwaitOslo, NorwayContactNAI Kuwait
- Page 52 and 53: Moscow, Russian FederationSt. Peter
- Page 54 and 55: Madrid, SpainStockholm, SwedenConta
- Page 56 and 57: Istanbul, TurkeyKiev, UkraineContac
- Page 58 and 59: Latin AmericaSECTION CONTENTSBuenos
- Page 60 and 61: Campinas, BrazilCuritiba, BrazilCon
- Page 62 and 63: Sao Paulo, BrazilSantiago, ChileCon
- Page 64 and 65: Ciudad Juarez, Chihuahua, MexicoGua
- Page 66 and 67: Matamoros, Tamaulipas, MexicoMexica
- Page 68 and 69: Reynosa, MexicoSaltillo, Coahuila,
- Page 70 and 71: Torreon, Coahulia, MexicoCaracas, V
- Page 72 and 73: Birmingham, AlabamaHuntsville, Deca
- Page 74 and 75: Jonesboro, ArkansasLittle Rock, Ark
- Page 76 and 77: Marin County, CaliforniaMonterey, C
- Page 78 and 79: Sacramento, CaliforniaSan Diego, Ca
- Page 80 and 81: Santa Clara County (Silicon Valley)
- Page 82 and 83: Colorado Springs, ColoradoDenver, C
- Page 84 and 85:
Fort Lauderdale, FloridaFt. Myers/N
- Page 86 and 87:
Miami, FloridaOrlando, FloridaConta
- Page 88 and 89:
Atlanta, GeorgiaHonolulu, HawaiiCon
- Page 90 and 91:
Chicago, IllinoisSpringfield, Illin
- Page 92 and 93:
Cedar Rapids, Iowa City, IowaDavenp
- Page 94 and 95:
Wichita, KansasLexington, KentuckyC
- Page 96 and 97:
Monroe, LouisianaNew Orleans, Louis
- Page 98 and 99:
Suburban MarylandBoston, Massachuse
- Page 100 and 101:
Grand Rapids, MichiganLansing, Mich
- Page 102 and 103:
St. Louis, MissouriBozeman, Montana
- Page 104 and 105:
Omaha, NebraskaLas Vegas, NevadaCon
- Page 106 and 107:
Portsmouth, New HampshireAtlantic C
- Page 108 and 109:
Ocean/Monmouth Counties (“Shore M
- Page 110 and 111:
Las Cruces, New MexicoAlbany, New Y
- Page 112 and 113:
Asheville, North CarolinaCharlotte,
- Page 114 and 115:
Fargo, North DakotaAkron, OhioConta
- Page 116 and 117:
Cleveland, OhioColumbus, OhioContac
- Page 118 and 119:
Tulsa, OklahomaPortland, OregonCont
- Page 120 and 121:
Bucks County, PennsylvaniaHarrisbur
- Page 122 and 123:
Pittsburgh, PennsylvaniaSchuylkill
- Page 124 and 125:
Greenville/Spartanburg/Anderson Cou
- Page 126 and 127:
Knoxville, TennesseeMemphis, Tennes
- Page 128 and 129:
Beaumont, TexasCorpus Christi, Texa
- Page 130 and 131:
Fort Worth, TexasHouston, TexasCont
- Page 132 and 133:
Texarkana (Bowie County, Texas/Mill
- Page 134 and 135:
Northern VirginiaSeattle/Puget Soun
- Page 136 and 137:
Madison, WisconsinMilwaukee, Wiscon
- Page 138 and 139:
Jackson Hole, WyomingContactNAI Jac
- Page 140:
Build on the power of our network.N


