Chicago, IllinoisSpringfield, IllinoisContact<strong>NAI</strong> Hiffman+630 932 1234Metropolitan AreaEconomic Overview2009Population2014 EstimatedPopulationEmploymentPopulationHouseholdAverage IncomeMedianHousehold IncomeTotal PopulationMedian Age9,540,7369,581,5564,981,030$79,857$66,13236Chicago, the third largest metropolitan area in the USafter New York and Los Angeles, is the most influentialeconomic region between the East and West Coasts.Situated at the geographical heart of the nation, Chicago’slocation advantages have fostered its development into aninternational center for banking, securities, high technology,air transportation, business services, manufacturing,wholesale and retail trade.The downtown office market experienced four consecutivequarters of negative net absorption and rising vacanciesduring 2009. Throughout the market, Class A and Class Bbuildings are suffering from the highest vacancies,each above 16%. While three projects representing over3.6 million SF were delivered during 2009, there is noongoing construction, as any proposed projects have beenput on hold until the financial markets and the economybegin to recover. Vacancy should level off in <strong>2010</strong> astransaction velocity continues to accelerate.Chicago’s suburban office market is composed of severalscattered pockets of corporate parks and high-rise officetowers and experiences historically higher vacancy rates,larger swings in net absorption, and lower asking rents thandowntown. Suburban vacancy rates have been risingsteadily since 2008, eclipsing 22% in 2009. Leasing activityis expected to pick up during <strong>2010</strong> as asking rents continueto slide and landlords offer aggressive concessionpackages. This should result in stabilizing vacancy rates forthe suburban office market.The second largest industrial market and the most importanttransportation hub in the country, Chicago’s industrialmarket was challenged during 2009 due to lack ofconsumer spending, difficulty obtaining credit and economicuncertainty. New construction projects are few as developershave responded to market conditions. Lack of new deliveries,combined with an increase in transactional activity, will helpthe market eventually rebound.Chicago’s expansive intermodal developments showcontinued success due to their ability to offer tremendoustransportation savings to importing operations. The nation’slargest inland port, the CenterPoint Intermodal Center,has fueled the regions growth, securing its importance bothnationally and internationally.Contact<strong>NAI</strong> True+1 217 787 2800Metropolitan AreaEconomic Overview2009Population2014 EstimatedPopulationEmploymentPopulationHouseholdAverage IncomeMedianHousehold IncomeTotal PopulationMedian Age207,549209,973150,563$60,441$55,95039Springfield, the capital of Illinois, accounts for approximatelyhalf of the population in the metropolitan areas of Sangamonand Menard counties. Springfield’s major employmentsectors are government, medical, public service and smallbusiness. Money for commercial real estate loans is readilyavailable. Springfield's current economy has been impactedto a lesser extent than that of the national economy.Government is the largest employer in the Springfield area.The two largest private employers in the region are St. JohnsHospital and Memorial Hospital, including the SIU School ofMedicine. Over the last year, there have been some majormedical developments including a cancer research center,a new hospital and a $40 million expansion of the SpringfieldClinic. Current medical developments include another50-bed acute care hospital and an orthopedic medicalfacility with rehabilitation services. Higher educationopportunities include the University of Illinois at Springfield,Southern Illinois University School of Medicine and LincolnLand Community College. Robert Morris University andBenedictine University at Springfield make up the privatecolleges in the area.Retail growth in Springfield is recovering with the opening ofnational chain stores and big-box users like Super Wal-Mart,Menards and Gander Mountain over the past 18 months.Scheels is planned to open soon in the area with a beliefthat other national chain stores will continue to locate inSpringfield. The Abraham Lincoln Museum and Library aretwo prestigious visitor/tourist attractions in Springfield.Recreation opportunities in Springfield are plentiful withover 30 public parks offering tennis courts, ice rinks andswimming pools. There are nine public golf courses, twocountry club golf courses, indoor/outdoor theatre venuesand a 4,235-acre lake.Despite the breadth of history, culture and recreationalopportunities found in Springfield, the cost of living remainslow. Springfield has consistently been one of the mostaffordable communities in Illinois with robust residentialsales in 2009.Chicago At A Glance(Rent/SF/YR) Low High Effective Avg. VacancyDOWNTOWN OFFICENew Construction (AAA)Class A (Prime)Class B (Secondary)SUBURBAN OFFICENew Construction (AAA)Class A (Prime)Class B (Secondary)INDUSTRIALBulk WarehouseManufacturingHigh Tech/R&DRETAIL$$$$$$$$$45.0030.0021.0023.0022.0017.502.153.005.75$$$$$$$$$60.0055.0036.0030.0030.0023.006.006.2510.00$$$$$$$$$50.0042.0028.0025.7423.1519.084.104.407.5035.2%16.1%17.0%18.6%23.4%23.5%11.7%11.7%11.7%Downtown$ 22.00 $ 220.00 N/A 8.2%Neighborhood Service CentersSub Regional CentersRegional Malls$$$12.0010.0020.00$$$26.0014.0080.00N/AN/AN/A9.6%9.8%7.8%DEVELOPMENT LAND Low HighOffice in CBDLand in Office ParksLand in Industrial Parks)Office/Industrial Land - Non-parkRetail/<strong>Commercial</strong> Land )Residential$ 80.00 $ 500.00$ 300,000.00 $ 700,000.00$ 120,000.00 $ 435,000.00$ 265,000.00 $ 575,000.00$ 700,000.00 $ 1,300,000.00$ 50,000.00 $ 1,000,000.00Springfield At A Glance(Rent/SF/YR) Low High Effective Avg. VacancyDOWNTOWN OFFICENew Construction (AAA)Class A (Prime)Class B (Secondary)SUBURBAN OFFICENew Construction (AAA)Class A (Prime)Class B (Secondary)INDUSTRIALBulk WarehouseManufacturingHigh Tech/R&DRETAILDowntownNeighborhood Service CentersCommunity Power CenterRegional Malls$$$$$$$$N/A14.0010.0026.0016.009.002.50N/AN/A8.0010.00N/AN/A$$$$$$$$N/A18.0013.5035.0020.0016.005.00N/AN/A15.0023.00N/AN/A$$$$$$$$N/A16.0011.0030.0016.0014.004.00N/AN/A11.0017.00N/AN/AN/A20.0%15.0%10.0%10.0%15.0%10.0%N/AN/A12.0%12.0%N/AN/ADEVELOPMENT LAND Low/Acre High/AcreOffice in CBDLand in Office ParksLand in Industrial ParksOffice/Industrial Land - Non-parkRetail/<strong>Commercial</strong> LandResidential$$$$$$450,000.00130,000.0035,000.0030,000.00130,000.005,000.00$$$$$$945,000.00250,000.00100,000.00200,000.00480,000.0025,000.00<strong>2010</strong> <strong>Global</strong> <strong>Market</strong> <strong>Report</strong> ■ www.naiglobal.com 89
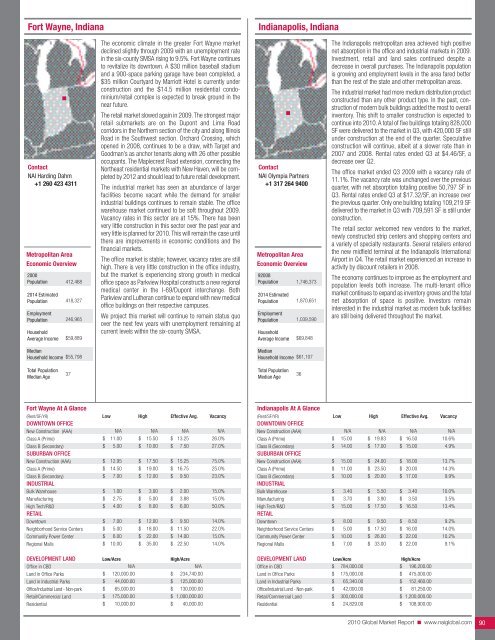
Fort Wayne, IndianaIndianapolis, IndianaContact<strong>NAI</strong> Harding Dahm+1 260 423 4311Metropolitan AreaEconomic Overview2000Population2014 EstimatedPopulationEmploymentPopulationHouseholdAverage Income412,468418,327246,965$59,889The economic climate in the greater Fort Wayne marketdeclined slightly through 2009 with an unemployment ratein the six-county SMSA rising to 9.5%. Fort Wayne continuesto revitalize its downtown. A $30 million baseball stadiumand a 900-space parking garage have been completed, a$35 million Courtyard by Marriott Hotel is currently underconstruction and the $14.5 million residential condominium/retailcomplex is expected to break ground in thenear future.The retail market slowed again in 2009. The strongest majorretail submarkets are on the Dupont and Lima Roadcorridors in the Northern section of the city and along IllinoisRoad in the Southwest section. Orchard Crossing, whichopened in 2008, continues to be a draw, with Target andGoodman’s as anchor tenants along with 26 other possibleoccupants. The Maplecrest Road extension, connecting theNortheast residential markets with New Haven, will be completedby 2012 and should lead to future retail development.The industrial market has seen an abundance of largerfacilities become vacant while the demand for smallerindustrial buildings continues to remain stable. The officewarehouse market continued to be soft throughout 2009.Vacancy rates in this sector are at 15%. There has beenvery little construction in this sector over the past year andvery little is planned for <strong>2010</strong>. This will remain the case untilthere are improvements in economic conditions and thefinancial markets.The office market is stable; however, vacancy rates are stillhigh. There is very little construction in the office industry,but the market is experiencing strong growth in medicaloffice space as Parkview Hospital constructs a new regionalmedical center in the I-69/Dupont interchange. BothParkview and Lutheran continue to expand with new medicaloffice buildings on their respective campuses.We project this market will continue to remain status quoover the next few years with unemployment remaining atcurrent levels within the six-county SMSA.Contact<strong>NAI</strong> Olympia Partners+1 317 264 9400Metropolitan AreaEconomic Overview92008Population2014 EstimatedPopulationEmploymentPopulationHouseholdAverage Income1,746,3731,870,6511,039,590$69,848The Indianapolis metropolitan area achieved high positivenet absorption in the office and industrial markets in 2009.Investment, retail and land sales continued despite adecrease in overall purchases. The Indianapolis populationis growing and employment levels in the area fared betterthan the rest of the state and other metropolitan areas.The industrial market had more medium distribution productconstructed than any other product type. In the past, constructionof modern bulk buildings added the most to overallinventory. This shift to smaller construction is expected tocontinue into <strong>2010</strong>. A total of five buildings totaling 828,000SF were delivered to the market in Q3, with 420,000 SF stillunder construction at the end of the quarter. Speculativeconstruction will continue, albeit at a slower rate than in2007 and 2008. Rental rates ended Q3 at $4.46/SF, adecrease over Q2.The office market ended Q3 2009 with a vacancy rate of11.1%. The vacancy rate was unchanged over the previousquarter, with net absorption totaling positive 50,797 SF inQ3. Rental rates ended Q3 at $17.32/SF, an increase overthe previous quarter. Only one building totaling 109,219 SFdelivered to the market in Q3 with 709,591 SF is still underconstruction.The retail sector welcomed new vendors to the market,newly constructed strip centers and shopping centers anda variety of specialty restaurants. Several retailers enteredthe new midfield terminal at the Indianapolis InternationalAirport in Q4. The retail market experienced an increase inactivity by discount retailers in 2008.The economy continues to improve as the employment andpopulation levels both increase. The multi-tenant officemarket continues to expand as inventory grows and the totalnet absorption of space is positive. Investors remaininterested in the industrial market as modern bulk facilitiesare still being delivered throughout the market.MedianHousehold Income$55,798MedianHousehold Income$61,107Total PopulationMedian Age37Total PopulationMedian Age36Fort Wayne At A Glance(Rent/SF/YR) Low High Effective Avg. VacancyDOWNTOWN OFFICENew Construction (AAA)Class A (Prime)Class B (Secondary)SUBURBAN OFFICENew Construction (AAA)Class A (Prime)Class B (Secondary)INDUSTRIALBulk WarehouseManufacturingHigh Tech/R&DRETAILDowntownNeighborhood Service CentersCommunity Power CenterRegional Malls$$$$$$$$$$$$N/A11.005.0012.9514.507.001.002.754.007.005.006.0010.00$$$$$$$$$$$$N/A15.5010.0017.5019.0012.003.005.008.0012.0018.0022.0035.00$$$$$$$$$$$$N/A13.257.5015.2516.759.502.003.886.009.5011.5014.0022.50N/A26.0%27.0%75.0%25.0%23.0%15.0%15.0%50.0%14.0%22.0%15.0%14.0%DEVELOPMENT LAND Low/Acre High/AcreOffice in CBDLand in Office ParksLand in Industrial ParksOffice/Industrial Land - Non-park$$$N/A120,000.0044,000.0065,000.00$$$N/A234,740.00125,000.00130,000.00Retail/<strong>Commercial</strong> Land$ 175,000.00 $ 1,000,000.00Residential$ 10,000.00 $ 40,000.00Indianapolis At A Glance(Rent/SF/YR) Low High Effective Avg. VacancyDOWNTOWN OFFICENew Construction (AAA)Class A (Prime)Class B (Secondary)SUBURBAN OFFICENew Construction (AAA)Class A (Prime)Class B (Secondary)INDUSTRIAL$$$$$N/A15.0014.0015.0011.0010.00$$$$$N/A19.8317.0024.0023.5020.00N/A$ 16.50$ 15.00$ 18.00$ 20.00$ 17.00N/A10.6%4.9%13.7%14.3%9.9%Bulk WarehouseManufacturing$$3.403.70$$5.503.90$$3.403.5010.0%3.5%High Tech/R&DRETAIL$ 15.00 $ 17.50 $ 16.50 13.4%Downtown$ 8.00 $ 9.50 $ 8.50 9.2%Neighborhood Service CentersCommunity Power CenterRegional Malls$$$5.0010.007.00$$$17.5026.0033.00$ 16.00$ 22.00$ 22.0014.0%10.2%9.1%DEVELOPMENT LAND Low/Acre High/AcreOffice in CBDLand in Office ParksLand in Industrial ParksOffice/Industrial Land - Non-park$$$$784,000.00175,000.0065,340.0042,000.00$$$$196,200.00475,000.00152,460.0081,250.00Retail/<strong>Commercial</strong> Land$ 300,000.00 $ 1,200,000.00Residential$ 24,829.00 $ 108,900.00<strong>2010</strong> <strong>Global</strong> <strong>Market</strong> <strong>Report</strong> ■ www.naiglobal.com 90
- Page 1 and 2:
CommercialCommercial Real Estate Se
- Page 3 and 4:
■ ■ ■ Table of ContentsGENERA
- Page 5 and 6:
Global OutlookCommercial real estat
- Page 7 and 8:
38.3% in November 2009. At the same
- Page 9 and 10:
quality than the Census properties.
- Page 11 and 12:
SaskatchewanSaskatchewan is a small
- Page 13 and 14:
As 2009 draws to a close, there is
- Page 15 and 16:
Global investment interest largely
- Page 18 and 19:
ChinaChina continued to post large
- Page 20 and 21:
MalaysiaWith Malaysia’s dependenc
- Page 22 and 23:
■ US Highlights - Northeast Regio
- Page 24 and 25:
■ US Highlights - Midwest Region
- Page 26 and 27:
■ US Highlights - West Region■
- Page 28 and 29:
Melbourne, AustraliaBeijing, ChinaC
- Page 30 and 31:
Shanghai, ChinaXiamen, ChinaContact
- Page 32 and 33:
Delhi, Gurgaon, IndiaHyderabad, Pra
- Page 34 and 35:
Punjab, IndiaTokyo, JapanContactNAI
- Page 36 and 37:
Seoul, South KoreaTaipei, TaiwanCon
- Page 38 and 39:
Calgary, Alberta, CanadaEdmonton, A
- Page 40 and 41: Halifax, Nova Scotia, CanadaOttawa,
- Page 42 and 43: Regina, Saskatchewan, CanadaContact
- Page 44 and 45: Vienna, AustriaThe Baltics (Latvia/
- Page 46 and 47: Copenhagen, DenmarkFinlandContactNA
- Page 48 and 49: Athens, GreeceReykjavik IcelandCont
- Page 50 and 51: KuwaitOslo, NorwayContactNAI Kuwait
- Page 52 and 53: Moscow, Russian FederationSt. Peter
- Page 54 and 55: Madrid, SpainStockholm, SwedenConta
- Page 56 and 57: Istanbul, TurkeyKiev, UkraineContac
- Page 58 and 59: Latin AmericaSECTION CONTENTSBuenos
- Page 60 and 61: Campinas, BrazilCuritiba, BrazilCon
- Page 62 and 63: Sao Paulo, BrazilSantiago, ChileCon
- Page 64 and 65: Ciudad Juarez, Chihuahua, MexicoGua
- Page 66 and 67: Matamoros, Tamaulipas, MexicoMexica
- Page 68 and 69: Reynosa, MexicoSaltillo, Coahuila,
- Page 70 and 71: Torreon, Coahulia, MexicoCaracas, V
- Page 72 and 73: Birmingham, AlabamaHuntsville, Deca
- Page 74 and 75: Jonesboro, ArkansasLittle Rock, Ark
- Page 76 and 77: Marin County, CaliforniaMonterey, C
- Page 78 and 79: Sacramento, CaliforniaSan Diego, Ca
- Page 80 and 81: Santa Clara County (Silicon Valley)
- Page 82 and 83: Colorado Springs, ColoradoDenver, C
- Page 84 and 85: Fort Lauderdale, FloridaFt. Myers/N
- Page 86 and 87: Miami, FloridaOrlando, FloridaConta
- Page 88 and 89: Atlanta, GeorgiaHonolulu, HawaiiCon
- Page 92 and 93: Cedar Rapids, Iowa City, IowaDavenp
- Page 94 and 95: Wichita, KansasLexington, KentuckyC
- Page 96 and 97: Monroe, LouisianaNew Orleans, Louis
- Page 98 and 99: Suburban MarylandBoston, Massachuse
- Page 100 and 101: Grand Rapids, MichiganLansing, Mich
- Page 102 and 103: St. Louis, MissouriBozeman, Montana
- Page 104 and 105: Omaha, NebraskaLas Vegas, NevadaCon
- Page 106 and 107: Portsmouth, New HampshireAtlantic C
- Page 108 and 109: Ocean/Monmouth Counties (“Shore M
- Page 110 and 111: Las Cruces, New MexicoAlbany, New Y
- Page 112 and 113: Asheville, North CarolinaCharlotte,
- Page 114 and 115: Fargo, North DakotaAkron, OhioConta
- Page 116 and 117: Cleveland, OhioColumbus, OhioContac
- Page 118 and 119: Tulsa, OklahomaPortland, OregonCont
- Page 120 and 121: Bucks County, PennsylvaniaHarrisbur
- Page 122 and 123: Pittsburgh, PennsylvaniaSchuylkill
- Page 124 and 125: Greenville/Spartanburg/Anderson Cou
- Page 126 and 127: Knoxville, TennesseeMemphis, Tennes
- Page 128 and 129: Beaumont, TexasCorpus Christi, Texa
- Page 130 and 131: Fort Worth, TexasHouston, TexasCont
- Page 132 and 133: Texarkana (Bowie County, Texas/Mill
- Page 134 and 135: Northern VirginiaSeattle/Puget Soun
- Page 136 and 137: Madison, WisconsinMilwaukee, Wiscon
- Page 138 and 139: Jackson Hole, WyomingContactNAI Jac
- Page 140:
Build on the power of our network.N


