Jonesboro, ArkansasLittle Rock, ArkansasContact<strong>NAI</strong> Halsey+1 870 972 9191Metropolitan AreaEconomic Overview2009Population2014 EstimatedPopulationEmploymentPopulationHouseholdAverage IncomeMedianHousehold Income121,875135,08253,430$52,949$39,936Jonesboro experienced growth in many sectors during2009, including education, medical and industrial. ArkansasState University enjoyed record enrollment for the secondyear in a row. Key industries in Jonesboro continue to beretail, industrial, office and education.The industrial sector boomed in 2009 between theannouncement of Nordex USA’s plan to construct a $100million wind-energy plant in the Jonesboro Industrial Parkand Alberto Culver, also located in the Jonesboro IndustrialPark, expanding to allow for even more jobs and productionoutside of Jonesboro. Startek, an in-bound call centerthat fields calls for AT&T customers, had a huge hiringupswing at the beginning of 2009, expanding to well over600 employees.The retail sector contracted in 2009 as shown by the closureof Steinmart, Steve & Barry’s and Circuit City, but madeprogress to regain ground with the arrivals of Olive Garden,Murphy Oil Convenience Store, Sport Clips for Men, OfficeDepot, a third Burger King location, and a Best Buy. Themultifamily market showed a slight upturn with theconstruction of The Grove student housing, fully furnishedapartments located just off campus from Arkansas StateUniversity. The largest announcement of 2009 was that NEABaptist Memorial Hospital was approved for construction ofa $200 million, 250 bed hospital on the Northeastern sideof Jonesboro. This has called for area growth and manyresidential zones being quickly re-zoned to commercial,which is expected to continue well into <strong>2010</strong>.Jonesboro saw several significant transactions in 2009including the sale of a new office building valued at$1.5 million to Merrill Lynch, the new location of E.C.Barton's Surplus Warehouse and the purchase of propertyfor Ritter's corporate campus, an internet, TV, and phoneprovider headquartered here.Contact<strong>NAI</strong> Dan Robinson& Associates+1 501 224 7500Metropolitan AreaEconomic Overview2009Population2014 EstimatedPopulationEmploymentPopulationHouseholdAverage IncomeMedianHousehold Income690,000746,933423,829$60,500$49,636Little Rock's growth sectors are medical, government andinstitutional. Suburban Little Rock is experiencing amuch slower absorption in retail growth and multifamilydevelopment. The SMA has been positively impacted withnatural gas exploration (Fayetteville Shale) and wind energyrelated manufacturing. The bedroom communities are alsodeveloping their identities as potential corporate officelocations.Office market activity is occurring in the bedroomcommunities of Benton, Maumelle and particularly Conway.Internal growth is absorbing the second generation officespace in the CBD and West Little Rock. With Verizon'spurchase of Alltel's corporate campus (Midtown) the anticipationis this campus will become available. Productionfacilities for natural gas and wind energy are beingcompleted. Food grade production facilities are alsocoming online.There is an abundance of first generation retail space inplace or approved in high income areas or along hightraffic corridors. City-wide limited infill activity will continue.The most prominent infill location is just north of I-630 onUniversity Ave.The Little Rock investment market is primarily an owner/usermarket. Fast food facilities tend to be the segment mostprone to investment activity. However, this activity is movinginto the bedroom communities. Multifamily activity hasslowed. Projects are on the drawing board seeking sourcesof funding.Time, distance and available infrastructure in close proximityto major employment centers have caused developers toredirect their site searchs along the I-430 corridor.Arkansas's favorable tourism industry entices the entrepreneurialspirit and restaurants and hotel facilities continue toemerge but at a slower pace in the CBD and suburbanmarkets. There is serious competition for market share.The community of Conway recently announced that it willhouse corporate offices for two major companies, HewlettPackard and Southwestern Energy Company. Searcyannounced the facility expansion of Schulze & Burch BiscuitCo., a specialty baking company out of Chicago, IL.Total PopulationMedian Age35Total PopulationMedian Age37Jonesboro At A Glance(Rent/SF/YR) Low High Effective Avg. VacancyDOWNTOWN OFFICENew Construction (AAA)Class A (Prime)Class B (Secondary)SUBURBAN OFFICENew Construction (AAA)Class A (Prime)Class B (Secondary)INDUSTRIALBulk WarehouseManufacturingHigh Tech/R&DRETAILDowntownNeighborhood Service CentersCommunity Power CenterRegional Malls$$$$$$$$N/A14.0010.0018.0014.008.003.00N/AN/AN/A10.00N/A18.00$$$$$$$$N/A22.0016.0022.0020.0015.006.00N/AN/AN/A20.00N/A32.00$$$$$$$$N/A12.0015.0018.0018.0012.003.50N/AN/AN/A14.00N/A25.00N/AN/AN/A10.0%10.0%10.0%10.0%N/AN/AN/AN/AN/A10.0%DEVELOPMENT LAND Low/Acre High/AcreOffice in CBDLand in Office ParksLand in Industrial ParksOffice/Industrial Land - Non-parkRetail/<strong>Commercial</strong> LandResidential$$$$N/A120,000.005,000.005,000.00N/A8,000.00$$$$N/A330,000.0020,000.0015,000.00N/A20,000.00Little Rock At A Glance(Rent/SF/YR) Low High Effective Avg. VacancyDOWNTOWN OFFICENew Construction (AAA)Class A (Prime)Class B (Secondary)SUBURBAN OFFICENew Construction (AAA)Class A (Prime)Class B (Secondary)INDUSTRIALBulk WarehouseManufacturingHigh Tech/R&DRETAILDowntownNeighborhood Service CentersCommunity Power CenterRegional Malls$$$$$$$$$$$$20.0017.0010.0022.0016.0014.002.501.506.00N/A20.0014.0025.00$$$$$$$$$$$$24.0019.5014.0024.0020.0016.505.006.909.50N/A35.0030.0040.00N/AN/AN/AN/AN/AN/AN/AN/AN/AN/AN/AN/AN/AN/A10.0%13.0%5.0%12.0%7.0%5.0%8.0%5.0%N/A40.0%60.0%N/ADEVELOPMENT LAND Low/Acre High/AcreOffice in CBDLand in Office ParksLand in Industrial ParksOffice/Industrial Land - Non-parkRetail/<strong>Commercial</strong> LandResidential$$$$$435,600.00174,240.0032,670.001.50108,900.00N/A$$$$$1,306,800.00522,760.00108,900.00261,360.001,306,800.00N/A<strong>2010</strong> <strong>Global</strong> <strong>Market</strong> <strong>Report</strong> ■ www.naiglobal.com 73
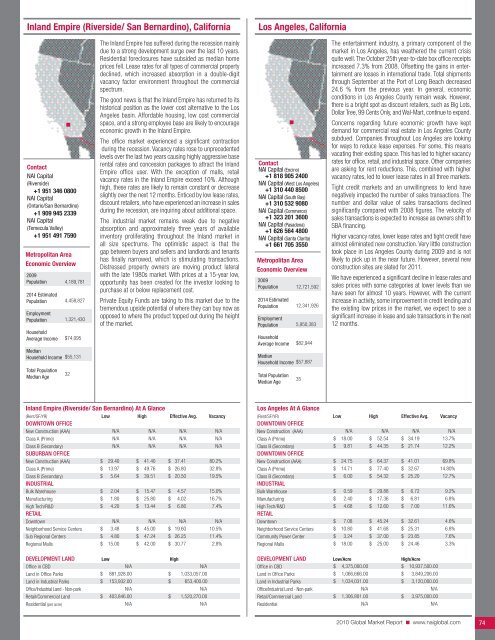
Inland Empire (Riverside/ San Bernardino), CaliforniaLos Angeles, CaliforniaContact<strong>NAI</strong> Capital(Riverside)+1 951 346 0800<strong>NAI</strong> Capital(Ontario/San Bernardino)+1 909 945 2339<strong>NAI</strong> Capital(Temecula Valley)+1 951 491 7590Metropolitan AreaEconomic Overview2009Population2014 EstimatedPopulationEmploymentPopulationHouseholdAverage IncomeMedianHousehold IncomeTotal PopulationMedian Age4,189,7814,458,8271,321,430$74,095$55,13132The Inland Empire has suffered during the recession mainlydue to a strong development surge over the last 10 years.Residential foreclosures have subsided as median homeprices fell. Lease rates for all types of commercial propertydeclined, which increased absorption in a double-digitvacancy factor environment throughout the commercialspectrum.The good news is that the Inland Empire has returned to itshistorical position as the lower cost alternative to the LosAngeles basin. Affordable housing, low cost commercialspace, and a strong employee base are likely to encourageeconomic growth in the Inland Empire.The office market experienced a significant contractionduring the recession. Vacancy rates rose to unprecedentedlevels over the last two years causing highly aggressive baserental rates and concession packages to attract the InlandEmpire office user. With the exception of malls, retailvacancy rates in the Inland Empire exceed 10%. Althoughhigh, these rates are likely to remain constant or decreaseslightly over the next 12 months. Enticed by low lease rates,discount retailers, who have experienced an increase in salesduring the recession, are inquiring about additional space.The industrial market remains weak due to negativeabsorption and approximately three years of availableinventory proliferating throughout the Inland market inall size spectrums. The optimistic aspect is that thegap between buyers and sellers and landlords and tenantshas finally narrowed, which is stimulating transactions.Distressed property owners are moving product lateralwith the late 1980s market. With prices at a 15-year low,opportunity has been created for the investor looking topurchase at or below replacement cost.Private Equity Funds are taking to this market due to thetremendous upside potential of where they can buy now asopposed to where the product topped out during the heightof the market.Contact<strong>NAI</strong> Capital (Encino)+1 818 905 2400<strong>NAI</strong> Capital (West Los Angeles)+1 310 440 8500<strong>NAI</strong> Capital (South Bay)+1 310 532 9080<strong>NAI</strong> Capital (Commerce)+1 323 201 3600<strong>NAI</strong> Capital (Pasadena)+1 626 564 4800<strong>NAI</strong> Capital (Santa Clarita)+1 661 705 3550Metropolitan AreaEconomic Overview2009Population2014 EstimatedPopulationEmploymentPopulationHouseholdAverage IncomeMedianHousehold IncomeTotal PopulationMedian Age12,721,59212,341,9265,950,383$82,944$57,88735The entertainment industry, a primary component of themarket in Los Angeles, has weathered the current crisisquite well. The October 25th year-to-date box office receiptsincreased 7.3% from 2008. Offsetting the gains in entertainmentare losses in international trade. Total shipmentsthrough September at the Port of Long Beach decreased24.6 % from the previous year. In general, economicconditions in Los Angeles County remain weak. However,there is a bright spot as discount retailers, such as Big Lots,Dollar Tree, 99 Cents Only, and Wal-Mart, continue to expand.Concerns regarding future economic growth have keptdemand for commercial real estate in Los Angeles Countysubdued. Companies throughout Los Angeles are lookingfor ways to reduce lease expenses. For some, this meansvacating their existing space. This has led to higher vacancyrates for office, retail, and industrial space. Other companiesare asking for rent reductions. This, combined with highervacancy rates, led to lower lease rates in all three markets.Tight credit markets and an unwillingness to lend havenegatively impacted the number of sales transactions. Thenumber and dollar value of sales transactions declinedsignificantly compared with 2008 figures. The velocity ofsales transactions is expected to increase as owners shift toSBA financing.Higher vacancy rates, lower lease rates and tight credit havealmost eliminated new construction. Very little constructiontook place in Los Angeles County during 2009 and is notlikely to pick up in the near future. However, several newconstruction sites are slated for 2011.We have experienced a significant decline in lease rates andsales prices with some categories at lower levels than wehave seen for almost 10 years. However, with the currentincrease in activity, some improvement in credit lending andthe existing low prices in the market, we expect to see asignificant increase in lease and sale transactions in the next12 months.Inland Empire (Riverside/ San Bernardino) At A Glance(Rent/SF/YR) Low High Effective Avg. VacancyDOWNTOWN OFFICENew Construction (AAA)Class A (Prime)Class B (Secondary)SUBURBAN OFFICENew Construction (AAA)Class A (Prime)Class B (Secondary)INDUSTRIALBulk WarehouseManufacturingHigh Tech/R&DRETAILDowntownNeighborhood Service CentersSub Regional CentersRegional Malls$$$$$$$$$N/AN/AN/A29.4013.975.642.041.804.20N/A3.484.8015.00$$$$$$$$$N/AN/AN/A41.4049.7639.5115.4725.8013.44N/A45.0047.2442.00$$$$$$$$$N/AN/AN/A37.4126.8020.504.574.026.86N/A19.6026.2530.77N/AN/AN/A80.2%32.8%19.5%15.0%16.7%7.4%N/A10.5%11.4%2.8%DEVELOPMENT LAND Low HighOffice in CBDLand in Office ParksLand in Industrial ParksOffice/Industrial Land - Non-parkRetail/<strong>Commercial</strong> LandResidential (per acre)$$$N/A881,928.00153,932.00N/A403,846.00N/A$$$N/A1,033,057.00653,400.00N/A1,520,270.00N/ALos Angeles At A Glance(Rent/SF/YR) Low High Effective Avg. VacancyDOWNTOWN OFFICENew Construction (AAA)Class A (Prime)Class B (Secondary)DOWNTOWN OFFICENew Construction (AAA)Class A (Prime)Class B (Secondary)INDUSTRIALBulk WarehouseManufacturingHigh Tech/R&DRETAILDowntownNeighborhood Service CentersCommunity Power CenterRegional Malls$$$$$$$$$$$$N/A18.009.8124.7514.716.000.592.404.687.0810.803.2418.00$$$$$$$$$$$$N/A52.5444.3564.3777.4054.3229.8817.3612.6045.2441.6837.0025.00$$$$$$$$$$$$N/A34.1921.7441.0132.6725.206.726.817.0032.6125.3123.8524.46N/A13.7%12.2%69.8%14.80%12.7%9.2%6.8%11.6%4.6%6.8%7.6%3.3%DEVELOPMENT LAND Low/Acre High/AcreOffice in CBDLand in Office ParksLand in Industrial ParksOffice/Industrial Land - Non-parkRetail/<strong>Commercial</strong> LandResidential$$$$4,375,000.001,066,666.001,034,031.00N/A1,306,801.00N/A$$$$10,937,500.003,849,206.003,120,000.00N/A3,975,000.00N/A<strong>2010</strong> <strong>Global</strong> <strong>Market</strong> <strong>Report</strong> ■ www.naiglobal.com74
- Page 1 and 2:
CommercialCommercial Real Estate Se
- Page 3 and 4:
■ ■ ■ Table of ContentsGENERA
- Page 5 and 6:
Global OutlookCommercial real estat
- Page 7 and 8:
38.3% in November 2009. At the same
- Page 9 and 10:
quality than the Census properties.
- Page 11 and 12:
SaskatchewanSaskatchewan is a small
- Page 13 and 14:
As 2009 draws to a close, there is
- Page 15 and 16:
Global investment interest largely
- Page 18 and 19:
ChinaChina continued to post large
- Page 20 and 21:
MalaysiaWith Malaysia’s dependenc
- Page 22 and 23:
■ US Highlights - Northeast Regio
- Page 24 and 25: ■ US Highlights - Midwest Region
- Page 26 and 27: ■ US Highlights - West Region■
- Page 28 and 29: Melbourne, AustraliaBeijing, ChinaC
- Page 30 and 31: Shanghai, ChinaXiamen, ChinaContact
- Page 32 and 33: Delhi, Gurgaon, IndiaHyderabad, Pra
- Page 34 and 35: Punjab, IndiaTokyo, JapanContactNAI
- Page 36 and 37: Seoul, South KoreaTaipei, TaiwanCon
- Page 38 and 39: Calgary, Alberta, CanadaEdmonton, A
- Page 40 and 41: Halifax, Nova Scotia, CanadaOttawa,
- Page 42 and 43: Regina, Saskatchewan, CanadaContact
- Page 44 and 45: Vienna, AustriaThe Baltics (Latvia/
- Page 46 and 47: Copenhagen, DenmarkFinlandContactNA
- Page 48 and 49: Athens, GreeceReykjavik IcelandCont
- Page 50 and 51: KuwaitOslo, NorwayContactNAI Kuwait
- Page 52 and 53: Moscow, Russian FederationSt. Peter
- Page 54 and 55: Madrid, SpainStockholm, SwedenConta
- Page 56 and 57: Istanbul, TurkeyKiev, UkraineContac
- Page 58 and 59: Latin AmericaSECTION CONTENTSBuenos
- Page 60 and 61: Campinas, BrazilCuritiba, BrazilCon
- Page 62 and 63: Sao Paulo, BrazilSantiago, ChileCon
- Page 64 and 65: Ciudad Juarez, Chihuahua, MexicoGua
- Page 66 and 67: Matamoros, Tamaulipas, MexicoMexica
- Page 68 and 69: Reynosa, MexicoSaltillo, Coahuila,
- Page 70 and 71: Torreon, Coahulia, MexicoCaracas, V
- Page 72 and 73: Birmingham, AlabamaHuntsville, Deca
- Page 76 and 77: Marin County, CaliforniaMonterey, C
- Page 78 and 79: Sacramento, CaliforniaSan Diego, Ca
- Page 80 and 81: Santa Clara County (Silicon Valley)
- Page 82 and 83: Colorado Springs, ColoradoDenver, C
- Page 84 and 85: Fort Lauderdale, FloridaFt. Myers/N
- Page 86 and 87: Miami, FloridaOrlando, FloridaConta
- Page 88 and 89: Atlanta, GeorgiaHonolulu, HawaiiCon
- Page 90 and 91: Chicago, IllinoisSpringfield, Illin
- Page 92 and 93: Cedar Rapids, Iowa City, IowaDavenp
- Page 94 and 95: Wichita, KansasLexington, KentuckyC
- Page 96 and 97: Monroe, LouisianaNew Orleans, Louis
- Page 98 and 99: Suburban MarylandBoston, Massachuse
- Page 100 and 101: Grand Rapids, MichiganLansing, Mich
- Page 102 and 103: St. Louis, MissouriBozeman, Montana
- Page 104 and 105: Omaha, NebraskaLas Vegas, NevadaCon
- Page 106 and 107: Portsmouth, New HampshireAtlantic C
- Page 108 and 109: Ocean/Monmouth Counties (“Shore M
- Page 110 and 111: Las Cruces, New MexicoAlbany, New Y
- Page 112 and 113: Asheville, North CarolinaCharlotte,
- Page 114 and 115: Fargo, North DakotaAkron, OhioConta
- Page 116 and 117: Cleveland, OhioColumbus, OhioContac
- Page 118 and 119: Tulsa, OklahomaPortland, OregonCont
- Page 120 and 121: Bucks County, PennsylvaniaHarrisbur
- Page 122 and 123: Pittsburgh, PennsylvaniaSchuylkill
- Page 124 and 125:
Greenville/Spartanburg/Anderson Cou
- Page 126 and 127:
Knoxville, TennesseeMemphis, Tennes
- Page 128 and 129:
Beaumont, TexasCorpus Christi, Texa
- Page 130 and 131:
Fort Worth, TexasHouston, TexasCont
- Page 132 and 133:
Texarkana (Bowie County, Texas/Mill
- Page 134 and 135:
Northern VirginiaSeattle/Puget Soun
- Page 136 and 137:
Madison, WisconsinMilwaukee, Wiscon
- Page 138 and 139:
Jackson Hole, WyomingContactNAI Jac
- Page 140:
Build on the power of our network.N


