Fargo, North DakotaAkron, OhioContact<strong>NAI</strong> North Central+1 701 364 0244Metropolitan AreaEconomic Overview2009Population2014 EstimatedPopulationEmploymentPopulationHouseholdAverage IncomeMedianHousehold IncomeTotal PopulationMedian Age202,025225,041142,133$57,820$50,12732The 2009 Fargo market can best be described as sporadicand uneven. Demand for office and retail space is contractingwhile demand for industrial space is fairly stable. The multifamilysector remains active but with off-market properties.Current inventory of multi-family properties is very low.Excessive surplus office and retail inventories exist.Industrial inventory has a slight surplus. Key Fargo industrydrivers include health care, education, banking, insurance,agribusiness, shipping - transportation, and manufacturing.The office rental market is soft. An overabundance of leasespace with landlord concessions and competitive rentalrates prevails. Currently, there are approximately 219 leaselistings on the market. Rental rates vary from $7.00/SF to$8.00/SF for Class B space and up to $9.50/SF to$11.25/SF for Class A space located in start-up businessparks or along key corridor sites. The surplus of office spaceis expected to carry through <strong>2010</strong>. Closed office salesare off from last year's pace and are expected to finishbehind 2008.The industrial rental market is near equilibrium with anominal inventory surplus. Rental rates for Class B heatedspace range from $4.50/SF to $6.00/SF. Year to date closedindustrial sales are slightly behind 2008. The retail rentalmarket is saturated with 142 lease listings on the market.New retail projects including Amber Valley, Cityscapes Plaza,Eagle Run, Osgood, and Shoppes at Urban Plains, haveadded to the surplus. The surplus will carry through <strong>2010</strong>.Rental rates for Class A space are $14.00/SF to $16.00/SF.Class B space runs $9.00/SF to $10.75/SF. However, closedretail sales should finish comparable to 2008. MajorI-94 interchange projects are in progress in south Moorheadand south West Fargo creating renewed interest in anddevelopment at those sites. North Dakota State Universityopened a satellite business college & architecture departmentin the CBD.Special mention is made of the historic 2009 Red RiverFlood. Local and regional businesses lost at least one fullmonth of sales and production as a direct result of the flood.Economic impact was felt across all sectors as employerscontributed valuable labor and inventory to this effort.Contact<strong>NAI</strong> Cummins<strong>Real</strong> <strong>Estate</strong>+1 330 535 2661Metropolitan AreaEconomic Overview2009Population2014 EstimatedPopulationEmploymentPopulationHouseholdAverage IncomeMedianHousehold IncomeTotal PopulationMedian Age694,360680,988393,378$64,509$54,65839Situated near Lake Erie and several major interstates in theheart of the Midwest, Akron continues to attract entrepreneurs,investors and new businesses through its reputationfor innovation, low cost of living and strong institutionalinvestment in the community. Akron’s greatest growthin 2009 was in health care, education, technology and serviceindustries. Manufacturing and distribution continue tocontract from last year and retail has slowed with consumerspending.Greater Akron saw an increase in institutional developmentprojects throughout 2009. The construction of the $61.6million Infocision stadium at the University of Akron wascompleted this year and welcomed a capacity crowd onopening day. The requirement for educational office spacehas increased as the unemployed seek job and careertraining from ITT Technical Institute, Brown Mackie College,Strayer University and the like. These companies seek ClassA and B office space in markets across the country and haveopened multiple locations throughout Northeast Ohio toaccommodate growth in enrollment.The requirement for medical office space continues toexpand as groundbreaking takes place on hospital andmedical center projects throughout Summit County. SummaHospitals began construction on the Crystal Clinic andacquiring Robinson Memorial Hospital in Ravenna. AkronGeneral expanded the reach of its emergency medicalservices and wellness centers with new facilities and a 30+bed hospital planned for a suburban community.Investors have seen rising capitalization rates for cash-readybuyers and sale/leaseback opportunities abound. Sellerfinancing is now a viable option for many buyers and sellerswho are highly motivated to close transactions. Manufacturinghas taken a hit with the drastic reduction in automotiveassembly. With an ample supply of light industrial spaceavailable, tenant lease terms are shorter. Sale pricesand attractive lease rates offer great opportunities for buyersand tenants.Retail development expanded to suburban communities.These growing areas have lured regional and nationaltenants, speaking to the demand for mid to upscale services.Declining malls, strip centers and plazas are beingreinvented to include mixed use, light industrial, recordsstorage, trade schools and call center space.Fargo At A Glance(Rent/SF/YR) Low High Effective Avg. VacancyDOWNTOWN OFFICENew Construction (AAA)Class A (Prime)$$12.509.50$$16.5011.25$ 15.50$ 10.5012.5%10.5%Class B (Secondary)SUBURBAN OFFICE$ 7.00 $ 8.00 $ 7.50 11.3%New Construction (AAA)Class A (Prime)Class B (Secondary)INDUSTRIAL$$$12.0010.758.00$$$15.0012.5011.00$ 14.00$ 12.00$ 10.009.8%10.50%11.0%Bulk WarehouseManufacturingHigh Tech/R&DRETAIL$$4.505.75N/A$$6.006.90N/A$$5.506.50N/A9.9%9.9%N/ADowntownNeighborhood Service Centers$$14.0010.00$$16.0012.50$ 15.00$ 11.5014.3%8.5%Sub Regional Centers$ 8.00 $ 9.50 $ 9.00 8.5%Regional Malls$ 18.00 $ 20.00 $ 19.50 3.0%DEVELOPMENT LAND Low/Acre High/AcreOffice in CBD$ 9.20 $ 15.30Land in Office ParksLand in Industrial ParksOffice/Industrial Land - Non-parkRetail/<strong>Commercial</strong> LandResidential$$$$$87,120.0076,230.0084,942.00174,240.0021,780.00$$$$$174,240.00108,900.00130,680.00261,360.0054,450.00Akron At A Glance(Rent/SF/YR) Low High Effective Avg. VacancyDOWNTOWN OFFICENew Construction (AAA)Class A (Prime)Class B (Secondary)SUBURBAN OFFICENew Construction (AAA)Class A (Prime)Class B (Secondary)INDUSTRIALBulk WarehouseManufacturingHigh Tech/R&DRETAIL$$$$$$$$$19.0014.009.5017.5014.508.502.252.757.00$$$$$$$$$23.0019.0019.0021.0020.0014.004.003.758.00$$$$$$$$$16.5016.0014.0718.5018.5012.003.253.257.50N/A13.0%10.0%N/A13.0%12.0%14.0%12.0%7.0%DowntownNeighborhood Service CentersCommunity Power CenterRegional Malls$7.00$6.00$10.00$20.00$$$$17.0030.0017.0030.00$$$$12.0013.5014.0025.008.0%14.0%14.0%4.0%DEVELOPMENT LAND Low/Acre High/AcreOffice in CBDLand in Office ParksLand in Industrial ParksOffice/Industrial Land - Non-parkRetail/<strong>Commercial</strong> LandResidential$$$$$$350,000.00140,000.0060,000.0055,000.00100,000.0015,000.00$$$$$$525,000.00250,000.00100,000.0090,000.00300,000.0020,000.00<strong>2010</strong> <strong>Global</strong> <strong>Market</strong> <strong>Report</strong> ■ www.naiglobal.com 113
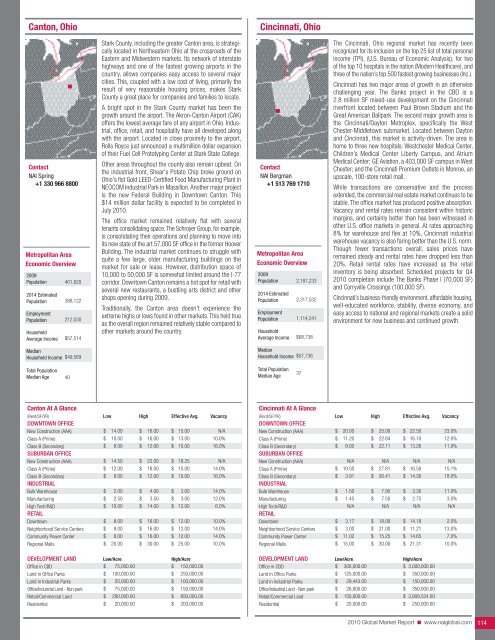
Canton, OhioCincinnati, OhioContact<strong>NAI</strong> Spring+1 330 966 8800Metropolitan AreaEconomic Overview2009Population2014 EstimatedPopulationEmploymentPopulationHouseholdAverage Income401,820388,122212,030$57,514Stark County, including the greater Canton area, is strategicallylocated in Northeastern Ohio at the crossroads of theEastern and Midwestern markets. Its network of interstatehighways and one of the fastest growing airports in thecountry, allows companies easy access to several majorcities. This, coupled with a low cost of living, primarily theresult of very reasonable housing prices, makes StarkCounty a great place for companies and families to locate.A bright spot in the Stark County market has been thegrowth around the airport. The Akron-Canton Airport (CAK)offers the lowest average fare of any airport in Ohio. Industrial,office, retail, and hospitality have all developed alongwith the airport. Located in close proximity to the airport,Rolls Royce just announced a multimillion dollar expansionof their Fuel Cell Prototyping Center at Stark State College.Other areas throughout the county also remain upbeat. Onthe industrial front, Shear's Potato Chip broke ground onOhio's fist Gold LEED-Certified Food Manufacturing Plant inNEOCOM Industrial Park in Massillon. Another major projectis the new Federal Building in Downtown Canton. This$14 million dollar facility is expected to be completed inJuly <strong>2010</strong>.The office market remained relatively flat with severaltenants consolidating space. The Schroyer Group, for example,is consolidating their operations and planning to move intoits new state of the art 57,000 SF office in the former HooverBuilding. The industrial market continues to struggle withquite a few large, older manufacturing buildings on themarket for sale or lease. However, distribution space of10,000 to 50,000 SF is somewhat limited around the I-77corridor. Downtown Canton remains a hot spot for retail withseveral new restaurants, a bustling arts district and othershops opening during 2009.Traditionally, the Canton area doesn't experience theextreme highs or lows found in other markets. This held trueas the overall region remained relatively stable compared toother markets around the country.Contact<strong>NAI</strong> Bergman+1 513 769 1710Metropolitan AreaEconomic Overview2009Population2014 EstimatedPopulationEmploymentPopulationHouseholdAverage Income2,187,2332,317,5321,114,241$68,738The Cincinnati, Ohio regional market has recently beenrecognized for its inclusion on the top 25 list of total personalincome (TPI), (U.S. Bureau of Economic Analysis), for twoof the top 10 hospitals in the nation (Modern Healthcare), andthree of the nation’s top 500 fastest growing businesses (Inc.).Cincinnati has two major areas of growth in an otherwisechallenging year. The Banks project in the CBD is a2.8 million SF mixed-use development on the Cincinnatiriverfront located between Paul Brown Stadium and theGreat American Ballpark. The second major growth area isthe Cincinnati/Dayton Metroplex, specifically the WestChester-Middletown submarket. Located between Daytonand Cincinnati, this market is activity-driven. The area ishome to three new hospitals: Westchester Medical Center,Children’s Medical Center Liberty Campus, and AtriumMedical Center; GE Aviation, a 403,000 SF campus in WestChester; and the Cincinnati Premium Outlets in Monroe, anupscale, 100-store retail mall.While transactions are conservative and the processextended, the commercial real estate market continues to bestable. The office market has produced positive absorption.Vacancy and rental rates remain consistent within historicmargins, and certainly better than has been witnessed inother U.S. office markets in general. At rates approaching8% for warehouse and flex at 10%, Cincinnati industrialwarehouse vacancy is also faring better than the U.S. norm.Though fewer transactions overall, sales prices haveremained steady and rental rates have dropped less than20%. Retail rental rates have increased as the retailinventory is being absorbed. Scheduled projects for Q4<strong>2010</strong> completion include The Banks Phase I (70,000 SF)and Corryville Crossings (100,000 SF).Cincinnati’s business-friendly environment, affordable housing,well-educated workforce, stability, diverse economy, andeasy access to national and regional markets create a solidenvironment for new business and continued growth.MedianHousehold Income$49,569MedianHousehold Income$57,738Total PopulationMedian Age40Total PopulationMedian Age37Canton At A Glance(Rent/SF/YR) Low High Effective Avg. VacancyDOWNTOWN OFFICENew Construction (AAA)Class A (Prime)Class B (Secondary)SUBURBAN OFFICENew Construction (AAA)Class A (Prime)Class B (Secondary)INDUSTRIALBulk WarehouseManufacturingHigh Tech/R&DRETAILDowntownNeighborhood Service CentersCommunity Power CenterRegional Malls$$$$$$$$$$$$$14.0010.008.0014.5012.008.002.002.5010.008.008.008.0020.00$$$$$$$$$$$$$16.0016.0012.0022.0018.0012.004.003.5014.0016.0016.0016.0030.00$$$$$$$$$$$$$15.0013.0010.0018.2515.0010.003.003.0012.0012.0012.0012.0025.00N/A10.0%16.0%N/A14.0%16.0%14.0%12.0%6.0%10.0%14.0%14.0%10.0%DEVELOPMENT LAND Low/Acre High/AcreOffice in CBDLand in Office ParksLand in Industrial ParksOffice/Industrial Land - Non-parkRetail/<strong>Commercial</strong> LandResidential$$$$$$75,000.00100,000.0020,000.0075,000.00200,000.0020,000.00$$$$$$150,000.00250,000.00100,000.00150,000.00850,000.00200,000.00Cincinnati At A Glance(Rent/SF/YR) Low High Effective Avg. VacancyDOWNTOWN OFFICENew Construction (AAA)Class A (Prime)Class B (Secondary)SUBURBAN OFFICENew Construction (AAA)Class A (Prime)Class B (Secondary)INDUSTRIALBulk WarehouseManufacturingHigh Tech/R&DRETAILDowntownNeighborhood Service CentersCommunity Power CenterRegional Malls$$$$$$$$$$$20.0011.208.00N/A10.503.911.501.45N/A3.173.0011.0215.00$$$$$$$$$$$25.0022.8422.11N/A27.8126.417.957.50N/A18.0021.0015.2530.00$$$$$$$$$$$22.5016.1013.26N/A16.5814.303.302.75N/A14.1811.2114.6521.3123.0%12.0%11.0%N/A15.1%18.0%11.0%3.0%N/A2.0%13.0%7.0%10.0%DEVELOPMENT LAND Low/Acre High/AcreOffice in CBD$ 300,000.00 $ 3,000,000.00Land in Office ParksLand in Industrial ParksOffice/Industrial Land - Non-park$$$125,000.0029,443.0026,000.00$$$350,000.00150,000.00350,000.00Retail/<strong>Commercial</strong> Land$ 150,000.00 $ 3,809,524.00Residential$ 20,000.00 $ 250,000.00<strong>2010</strong> <strong>Global</strong> <strong>Market</strong> <strong>Report</strong> ■ www.naiglobal.com 114
- Page 1 and 2:
CommercialCommercial Real Estate Se
- Page 3 and 4:
■ ■ ■ Table of ContentsGENERA
- Page 5 and 6:
Global OutlookCommercial real estat
- Page 7 and 8:
38.3% in November 2009. At the same
- Page 9 and 10:
quality than the Census properties.
- Page 11 and 12:
SaskatchewanSaskatchewan is a small
- Page 13 and 14:
As 2009 draws to a close, there is
- Page 15 and 16:
Global investment interest largely
- Page 18 and 19:
ChinaChina continued to post large
- Page 20 and 21:
MalaysiaWith Malaysia’s dependenc
- Page 22 and 23:
■ US Highlights - Northeast Regio
- Page 24 and 25:
■ US Highlights - Midwest Region
- Page 26 and 27:
■ US Highlights - West Region■
- Page 28 and 29:
Melbourne, AustraliaBeijing, ChinaC
- Page 30 and 31:
Shanghai, ChinaXiamen, ChinaContact
- Page 32 and 33:
Delhi, Gurgaon, IndiaHyderabad, Pra
- Page 34 and 35:
Punjab, IndiaTokyo, JapanContactNAI
- Page 36 and 37:
Seoul, South KoreaTaipei, TaiwanCon
- Page 38 and 39:
Calgary, Alberta, CanadaEdmonton, A
- Page 40 and 41:
Halifax, Nova Scotia, CanadaOttawa,
- Page 42 and 43:
Regina, Saskatchewan, CanadaContact
- Page 44 and 45:
Vienna, AustriaThe Baltics (Latvia/
- Page 46 and 47:
Copenhagen, DenmarkFinlandContactNA
- Page 48 and 49:
Athens, GreeceReykjavik IcelandCont
- Page 50 and 51:
KuwaitOslo, NorwayContactNAI Kuwait
- Page 52 and 53:
Moscow, Russian FederationSt. Peter
- Page 54 and 55:
Madrid, SpainStockholm, SwedenConta
- Page 56 and 57:
Istanbul, TurkeyKiev, UkraineContac
- Page 58 and 59:
Latin AmericaSECTION CONTENTSBuenos
- Page 60 and 61:
Campinas, BrazilCuritiba, BrazilCon
- Page 62 and 63:
Sao Paulo, BrazilSantiago, ChileCon
- Page 64 and 65: Ciudad Juarez, Chihuahua, MexicoGua
- Page 66 and 67: Matamoros, Tamaulipas, MexicoMexica
- Page 68 and 69: Reynosa, MexicoSaltillo, Coahuila,
- Page 70 and 71: Torreon, Coahulia, MexicoCaracas, V
- Page 72 and 73: Birmingham, AlabamaHuntsville, Deca
- Page 74 and 75: Jonesboro, ArkansasLittle Rock, Ark
- Page 76 and 77: Marin County, CaliforniaMonterey, C
- Page 78 and 79: Sacramento, CaliforniaSan Diego, Ca
- Page 80 and 81: Santa Clara County (Silicon Valley)
- Page 82 and 83: Colorado Springs, ColoradoDenver, C
- Page 84 and 85: Fort Lauderdale, FloridaFt. Myers/N
- Page 86 and 87: Miami, FloridaOrlando, FloridaConta
- Page 88 and 89: Atlanta, GeorgiaHonolulu, HawaiiCon
- Page 90 and 91: Chicago, IllinoisSpringfield, Illin
- Page 92 and 93: Cedar Rapids, Iowa City, IowaDavenp
- Page 94 and 95: Wichita, KansasLexington, KentuckyC
- Page 96 and 97: Monroe, LouisianaNew Orleans, Louis
- Page 98 and 99: Suburban MarylandBoston, Massachuse
- Page 100 and 101: Grand Rapids, MichiganLansing, Mich
- Page 102 and 103: St. Louis, MissouriBozeman, Montana
- Page 104 and 105: Omaha, NebraskaLas Vegas, NevadaCon
- Page 106 and 107: Portsmouth, New HampshireAtlantic C
- Page 108 and 109: Ocean/Monmouth Counties (“Shore M
- Page 110 and 111: Las Cruces, New MexicoAlbany, New Y
- Page 112 and 113: Asheville, North CarolinaCharlotte,
- Page 116 and 117: Cleveland, OhioColumbus, OhioContac
- Page 118 and 119: Tulsa, OklahomaPortland, OregonCont
- Page 120 and 121: Bucks County, PennsylvaniaHarrisbur
- Page 122 and 123: Pittsburgh, PennsylvaniaSchuylkill
- Page 124 and 125: Greenville/Spartanburg/Anderson Cou
- Page 126 and 127: Knoxville, TennesseeMemphis, Tennes
- Page 128 and 129: Beaumont, TexasCorpus Christi, Texa
- Page 130 and 131: Fort Worth, TexasHouston, TexasCont
- Page 132 and 133: Texarkana (Bowie County, Texas/Mill
- Page 134 and 135: Northern VirginiaSeattle/Puget Soun
- Page 136 and 137: Madison, WisconsinMilwaukee, Wiscon
- Page 138 and 139: Jackson Hole, WyomingContactNAI Jac
- Page 140: Build on the power of our network.N


