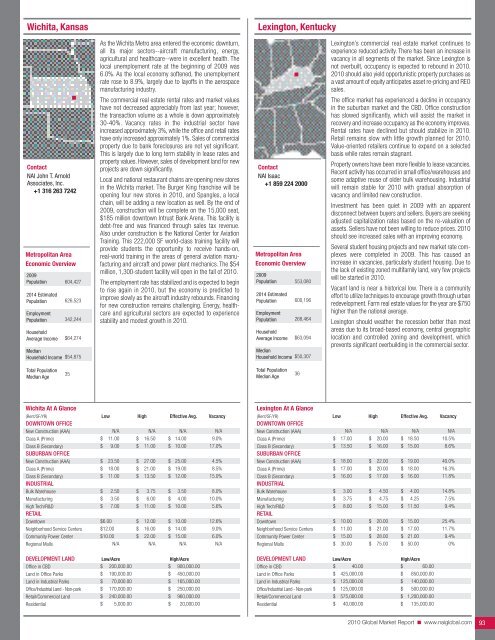
Wichita, KansasLexington, KentuckyContact<strong>NAI</strong> John T. ArnoldAssociates, Inc.+1 316 263 7242Metropolitan AreaEconomic Overview2009Population2014 EstimatedPopulationEmploymentPopulationHouseholdAverage IncomeMedianHousehold Income604,427626,523342,244$64,274$54,875As the Wichita Metro area entered the economic downturn,all its major sectors--aircraft manufacturing, energy,agricultural and healthcare--were in excellent health. Thelocal unemployment rate at the beginning of 2009 was6.0%. As the local economy softened, the unemploymentrate rose to 8.9%, largely due to layoffs in the aerospacemanufacturing industry.The commercial real estate rental rates and market valueshave not decreased appreciably from last year; however,the transaction volume as a whole is down approximately30-40%. Vacancy rates in the industrial sector haveincreased approximately 3%, while the office and retail rateshave only increased approximately 1%. Sales of commercialproperty due to bank foreclosures are not yet significant.This is largely due to long term stability in lease rates andproperty values. However, sales of development land for newprojects are down significantly.Local and national restaurant chains are opening new storesin the Wichita market. The Burger King franchise will beopening four new stores in <strong>2010</strong>, and Spangles, a localchain, will be adding a new location as well. By the end of2009, construction will be complete on the 15,000 seat,$185 million downtown Intrust Bank Arena. This facility isdebt-free and was financed through sales tax revenue.Also under construction is the National Center for AviationTraining. This 222,000 SF world-class training facility willprovide students the opportunity to receive hands-on,real-world training in the areas of general aviation manufacturingand aircraft and power plant mechanics. The $54million, 1,300-student facility will open in the fall of <strong>2010</strong>.The employment rate has stabilized and is expected to beginto rise again in <strong>2010</strong>, but the economy is predicted toimprove slowly as the aircraft industry rebounds. Financingfor new construction remains challenging. Energy, healthcareand agricultural sectors are expected to experiencestability and modest growth in <strong>2010</strong>.Contact<strong>NAI</strong> Isaac+1 859 224 2000Metropolitan AreaEconomic Overview2009Population2014 EstimatedPopulationEmploymentPopulationHouseholdAverage IncomeMedianHousehold Income553,080600,196268,464$63,094$50,307Lexington’s commercial real estate market continues toexperience reduced activity. There has been an increase invacancy in all segments of the market. Since Lexington isnot overbuilt, occupancy is expected to rebound in <strong>2010</strong>.<strong>2010</strong> should also yield opportunistic property purchases asa vast amount of equity anticipates asset re-pricing and REOsales.The office market has experienced a decline in occupancyin the suburban market and the CBD. Office constructionhas slowed significantly, which will assist the market inrecovery and increase occupancy as the economy improves.Rental rates have declined but should stabilize in <strong>2010</strong>.Retail remains slow with little growth planned for <strong>2010</strong>.Value-oriented retailers continue to expand on a selectedbasis while rates remain stagnant.Property owners have been more flexible to lease vacancies.Recent activity has occurred in small office/warehouses andsome adaptive reuse of older bulk warehousing. Industrialwill remain stable for <strong>2010</strong> with gradual absorption ofvacancy and limited new construction.Investment has been quiet in 2009 with an apparentdisconnect between buyers and sellers. Buyers are seekingadjusted capitalization rates based on the re-valuation ofassets. Sellers have not been willing to reduce prices. <strong>2010</strong>should see increased sales with an improving economy.Several student housing projects and new market rate complexeswere completed in 2009. This has caused anincrease in vacancies, particularly student housing. Due tothe lack of existing zoned multifamily land, very few projectswill be started in <strong>2010</strong>.Vacant land is near a historical low. There is a communityeffort to utilize techniques to encourage growth through urbanredevelopment. Farm real estate values for the year are $750higher than the national average.Lexington should weather the recession better than mostareas due to its broad-based economy, central geographiclocation and controlled zoning and development, whichprevents significant overbuilding in the commercial sector.Total PopulationMedian Age35Total PopulationMedian Age36Wichita At A Glance(Rent/SF/YR) Low High Effective Avg. VacancyDOWNTOWN OFFICENew Construction (AAA)Class A (Prime)Class B (Secondary)SUBURBAN OFFICENew Construction (AAA)Class A (Prime)Class B (Secondary)INDUSTRIALBulk WarehouseManufacturingHigh Tech/R&DRETAIL$$$$$$$$N/A11.009.0023.5018.0011.002.503.507.00$$$$$$$$N/A16.5011.0027.0021.0013.503.756.0011.00$$$$$$$$N/A14.0010.0025.0019.0012.003.504.0010.00N/A9.0%17.0%4.5%8.5%15.0%8.0%10.0%5.6%DowntownNeighborhood Service CentersCommunity Power CenterRegional Malls$6.00$12.00$10.00N/A$$$12.0016.0022.00N/A$$$10.0014.0015.00N/A12.6%9.0%6.0%N/ADEVELOPMENT LAND Low/Acre High/AcreOffice in CBDLand in Office ParksLand in Industrial ParksOffice/Industrial Land - Non-parkRetail/<strong>Commercial</strong> LandResidential$$$$$$200,000.00190,000.0070,000.00170,000.00240,000.005,000.00$$$$$$900,000.00450,000.00165,000.00250,000.00960,000.0020,000.00Lexington At A Glance(Rent/SF/YR) Low High Effective Avg. VacancyDOWNTOWN OFFICENew Construction (AAA)Class A (Prime)Class B (Secondary)SUBURBAN OFFICENew Construction (AAA)Class A (Prime)Class B (Secondary)INDUSTRIALBulk WarehouseManufacturingHigh Tech/R&DRETAILDowntownNeighborhood Service CentersCommunity Power CenterRegional Malls$$$$$$$$$$$$N/A17.0013.5018.0017.0016.003.003.758.0010.0011.0015.0030.00$$$$$$$$$$$$N/A20.0016.0022.0020.0017.004.504.7515.0020.0021.0028.0075.00$$$$$$$$$$$$N/A18.5015.0019.0018.0016.004.004.2511.5015.0017.0021.0050.00N/A10.5%8.6%40.0%16.3%11.8%14.8%7.5%9.4%25.4%11.7%9.4%0%DEVELOPMENT LAND Low/Acre High/AcreOffice in CBD$ 40.00 $ 60.00Land in Office ParksLand in Industrial ParksOffice/Industrial Land - Non-parkRetail/<strong>Commercial</strong> LandResidential$$$$$425,000.00125,000.00125,000.00575,000.0040,000.00$$$$$850,000.00140,000.00500,000.001,200,000.00135,000.00<strong>2010</strong> <strong>Global</strong> <strong>Market</strong> <strong>Report</strong> ■ www.naiglobal.com 93
Louisville, KentuckyBaton Rouge, LouisianaContact<strong>NAI</strong> Walter Wagner, Jr.Company <strong>Real</strong>tors, LLC+1 502 562 9200Metropolitan AreaEconomic Overview2009Population2014 EstimatedPopulationEmploymentPopulationHouseholdAverage Income1,252,7951,299,624684,103$61,277Over the past year, metropolitan Louisville’s commercial realestate market has weathered the recession relatively wellin spite of an unemployment rate that rose four points to10.3% and a limited influx of new businesses to the area.In other good news, home sales are up approximately 15%over 2008.The Louisville office market ended Q3 2009 with a vacancyrate of 11.2%, up from 10.7 % in 2008. Class A vacancystood at 13.3% compared to 13.7% for Class B and 6.9%for Class C space, The CBD reported a vacancy rate of 5.9%for Class A buildings. Net absorption was negative 68,943SF. The average rental rate in all classes was $15.49/SF,a 0.3% decrease from the end of Q2 2009. Class A sectorrents averaged $19.91/SF, Class B stood at $14.68/SF andClass C at $12.16/SF.The retail market did not experience a significant changeover the first three quarters of 2009. The vacancy rateincreased to 8.6%, up slightly from 8.4% in 2008. Netabsorption wavered between positive and negative territorythroughout the year, with indicators pointing to a relativelyflat or slightly negative result for the year. Vacant subleasespace decreased by 3,715 SF. Rental rates also decreasedslightly, ending at $11.97/SF for the year.The industrial market ended Q3 with a vacancy rate of13.2%, a slight increase over the previous quarter and upfrom 12% a year ago. Net absorption totaled positive1,299,350 SF. Vacant sublease space decreased, endingthe quarter at 1,251,872 SF. Rental rates were $3.57/SF, anincrease over the previous quarter.Louisville’s downtown arena continues to be a bright spot asthe major construction project in the area. Scheduled toopen in <strong>2010</strong>, the $250 million, multi-purpose arena isexpected to generate more than $100 million in downtowninvestment and construction.Contact<strong>NAI</strong> Latter & Blum+1 225 295 0800Metropolitan AreaEconomic Overview2009Population2014 EstimatedPopulationEmploymentPopulationHouseholdAverage Income773,208787,300387,346$60,749Baton Rouge, the Capital of Louisiana, has withstood theeconomic slowdown of 2008-2009 relatively well. Weeklywages increased from 2008, the Brooking Institution rankedBaton Rouge the sixth-best performing metro area in Q22009, and Forbes ranked Baton Rouge as the seventh-bestmid-sized city for job growth in the country.Baton Rouge has remained well insulated due to severaleconomic catalysts. Louisiana State University, with anenrollment of 35,000 calls Baton Rouge home along withseveral other universities and colleges. The inmost port onthe Mississippi River is located in Baton Rouge, generatinga strong barge and shipping base for industrial growth.Numerous plants take advantage of the Mississippi Riveraccess like DOW, Exxon, Shintech, Kaiser and Nucor.Other economic generators include Baton Rouge as thestate capital as well as having the I-10 and I-12 corridorrunning through the city. This provides a big boost to BatonRouge's hospitality sector. Medical is another large employerwith five major hospitals in the city.Although rental rates and occupancies have been holdingstrong across the board, Baton Rouge is finally seeing someinventory coming on line. Office vacancies for Class Aspace slipped to 9% citywide excluding the additionalsublease space that could top 100,000 SF or an additional2% vacancy by year’s end. Retail occupancies slipped aswell in 2009. Overall city vacancies were 12.4%, up 1%from a year earlier.The strongest sector this year has been multifamily with anear 95% occupancy rate citywide. In addition, the highestprice per door was paid for an apartment complex in thesale of the 300-unit Millennium, which topped $140,000per door.All things considered, Baton Rouge continues to show signsof a resilient economy with companies like Albemarleestablishing its corporate headquarters in the capital cityand outside investors looking at Baton Rouge and the GulfCoast region as a healthy place to invest.MedianHousehold Income$52,415MedianHousehold Income$47,801Total PopulationMedian Age39Total PopulationMedian Age34Louisville At A Glance(Rent/SF/YR) Low High Effective Avg. VacancyDOWNTOWN OFFICENew Construction (AAA)Class A (Prime)Class B (Secondary)SUBURBAN OFFICENew Construction (AAA)Class A (Prime)Class B (Secondary)INDUSTRIALBulk WarehouseManufacturingHigh Tech/R&DRETAILDowntownNeighborhood Service CentersCommunity Power CenterRegional Malls$$$$$$$$$$$$$18.2518.008.0018.5017.507.001.501.505.4511.0010.0015.0020.00$$$$$$$$$$$$$25.0024.0016.0025.0023.0014.004.504.508.2530.0020.0020.0040.00N/AN/AN/AN/AN/AN/AN/AN/AN/AN/AN/AN/AN/AN/A7.5%8.3%N/A18.0%19.5%13.4%12.4%9.0%8.6%10.0%12.0%4.0%DEVELOPMENT LAND Low/Acre High/AcreOffice in CBDLand in Office Parks$$550,000.00940,000.00$ 1,900,000.00$ 1,450,000.00Land in Industrial ParksOffice/Industrial Land - Non-parkRetail/<strong>Commercial</strong> Land)Residential$$$$25,000.0055,000.00150,000.0030,000.00$$$$110,000.00100,000.00850,000.00140,000.00Baton Rouge At A Glance(Rent/SF/YR) Low High Effective Avg. VacancyDOWNTOWN OFFICENew Construction (AAA)Class A (Prime)Class B (Secondary)SUBURBAN OFFICENew Construction (AAA)Class A (Prime)Class B (Secondary)INDUSTRIALBulk WarehouseManufacturingHigh Tech/R&DRETAILDowntownNeighborhood Service CentersCommunity Power CenterRegional Malls$$$$$$$$$$$24.0020.0012.5028.0017.9512.003.00N/AN/A12.008.0023.0012.00$$$$$$$$$$$28.0021.5016.0028.0023.0016.005.15N/AN/A24.0024.0040.0080.00$$$$$$$$$$$27.0020.7514.5028.0019.8014.754.00N/AN/A16.0015.0028.0035.0041.0%9.7%25.0%25.0%6.0%23.0%13.8%N/AN/A6.0%12.5%6.6%N/ADEVELOPMENT LAND Low/Acre High/AcreOffice in CBD$ 900,000.00 $ 1,750,000.00Land in Office ParksLand in Industrial ParksOffice/Industrial Land - Non-park$$$215,000.00130,000.0080,000.00$$$350,000.00260,000.00350,000.00Retail/<strong>Commercial</strong> Land$ 350,000.00 $ 1,250,000.00Residential$ 15,000.00 $ 50,000.00<strong>2010</strong> <strong>Global</strong> <strong>Market</strong> <strong>Report</strong> ■ www.naiglobal.com 94
- Page 1 and 2:
CommercialCommercial Real Estate Se
- Page 3 and 4:
■ ■ ■ Table of ContentsGENERA
- Page 5 and 6:
Global OutlookCommercial real estat
- Page 7 and 8:
38.3% in November 2009. At the same
- Page 9 and 10:
quality than the Census properties.
- Page 11 and 12:
SaskatchewanSaskatchewan is a small
- Page 13 and 14:
As 2009 draws to a close, there is
- Page 15 and 16:
Global investment interest largely
- Page 18 and 19:
ChinaChina continued to post large
- Page 20 and 21:
MalaysiaWith Malaysia’s dependenc
- Page 22 and 23:
■ US Highlights - Northeast Regio
- Page 24 and 25:
■ US Highlights - Midwest Region
- Page 26 and 27:
■ US Highlights - West Region■
- Page 28 and 29:
Melbourne, AustraliaBeijing, ChinaC
- Page 30 and 31:
Shanghai, ChinaXiamen, ChinaContact
- Page 32 and 33:
Delhi, Gurgaon, IndiaHyderabad, Pra
- Page 34 and 35:
Punjab, IndiaTokyo, JapanContactNAI
- Page 36 and 37:
Seoul, South KoreaTaipei, TaiwanCon
- Page 38 and 39:
Calgary, Alberta, CanadaEdmonton, A
- Page 40 and 41:
Halifax, Nova Scotia, CanadaOttawa,
- Page 42 and 43:
Regina, Saskatchewan, CanadaContact
- Page 44 and 45: Vienna, AustriaThe Baltics (Latvia/
- Page 46 and 47: Copenhagen, DenmarkFinlandContactNA
- Page 48 and 49: Athens, GreeceReykjavik IcelandCont
- Page 50 and 51: KuwaitOslo, NorwayContactNAI Kuwait
- Page 52 and 53: Moscow, Russian FederationSt. Peter
- Page 54 and 55: Madrid, SpainStockholm, SwedenConta
- Page 56 and 57: Istanbul, TurkeyKiev, UkraineContac
- Page 58 and 59: Latin AmericaSECTION CONTENTSBuenos
- Page 60 and 61: Campinas, BrazilCuritiba, BrazilCon
- Page 62 and 63: Sao Paulo, BrazilSantiago, ChileCon
- Page 64 and 65: Ciudad Juarez, Chihuahua, MexicoGua
- Page 66 and 67: Matamoros, Tamaulipas, MexicoMexica
- Page 68 and 69: Reynosa, MexicoSaltillo, Coahuila,
- Page 70 and 71: Torreon, Coahulia, MexicoCaracas, V
- Page 72 and 73: Birmingham, AlabamaHuntsville, Deca
- Page 74 and 75: Jonesboro, ArkansasLittle Rock, Ark
- Page 76 and 77: Marin County, CaliforniaMonterey, C
- Page 78 and 79: Sacramento, CaliforniaSan Diego, Ca
- Page 80 and 81: Santa Clara County (Silicon Valley)
- Page 82 and 83: Colorado Springs, ColoradoDenver, C
- Page 84 and 85: Fort Lauderdale, FloridaFt. Myers/N
- Page 86 and 87: Miami, FloridaOrlando, FloridaConta
- Page 88 and 89: Atlanta, GeorgiaHonolulu, HawaiiCon
- Page 90 and 91: Chicago, IllinoisSpringfield, Illin
- Page 92 and 93: Cedar Rapids, Iowa City, IowaDavenp
- Page 96 and 97: Monroe, LouisianaNew Orleans, Louis
- Page 98 and 99: Suburban MarylandBoston, Massachuse
- Page 100 and 101: Grand Rapids, MichiganLansing, Mich
- Page 102 and 103: St. Louis, MissouriBozeman, Montana
- Page 104 and 105: Omaha, NebraskaLas Vegas, NevadaCon
- Page 106 and 107: Portsmouth, New HampshireAtlantic C
- Page 108 and 109: Ocean/Monmouth Counties (“Shore M
- Page 110 and 111: Las Cruces, New MexicoAlbany, New Y
- Page 112 and 113: Asheville, North CarolinaCharlotte,
- Page 114 and 115: Fargo, North DakotaAkron, OhioConta
- Page 116 and 117: Cleveland, OhioColumbus, OhioContac
- Page 118 and 119: Tulsa, OklahomaPortland, OregonCont
- Page 120 and 121: Bucks County, PennsylvaniaHarrisbur
- Page 122 and 123: Pittsburgh, PennsylvaniaSchuylkill
- Page 124 and 125: Greenville/Spartanburg/Anderson Cou
- Page 126 and 127: Knoxville, TennesseeMemphis, Tennes
- Page 128 and 129: Beaumont, TexasCorpus Christi, Texa
- Page 130 and 131: Fort Worth, TexasHouston, TexasCont
- Page 132 and 133: Texarkana (Bowie County, Texas/Mill
- Page 134 and 135: Northern VirginiaSeattle/Puget Soun
- Page 136 and 137: Madison, WisconsinMilwaukee, Wiscon
- Page 138 and 139: Jackson Hole, WyomingContactNAI Jac
- Page 140: Build on the power of our network.N