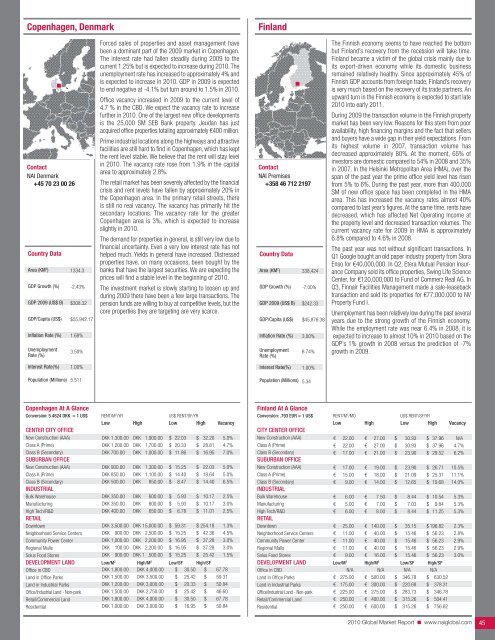
Copenhagen, DenmarkFinlandContact<strong>NAI</strong> Denmark+45 70 23 00 26Country DataArea (KM 2 )GDP Growth (%)GDP 2009 (US$ B)GDP/Capita (US$)Inflation Rate (%)UnemploymentRate (%)1334.3-2.43%$308.32$55,942.171.68%3.50%Forced sales of properties and asset management havebeen a dominant part of the 2009 market in Copenhagen.The interest rate had fallen steadily during 2009 to thecurrent 1.25% but is expected to increase during <strong>2010</strong>. Theunemployment rate has increased to approximately 4% andis expected to increase in <strong>2010</strong>. GDP in 2009 is expectedto end negative at -4.1% but turn around to 1.5% in <strong>2010</strong>.Office vacancy increased in 2009 to the current level of4.7 % in the CBD. We expect the vacancy rate to increasefurther in <strong>2010</strong>. One of the largest new office developmentsis the 25,000 SM SEB Bank property. Jeudan has justacquired office properties totaling approximately €400 million.Prime industrial locations along the highways and attractivefacilities are still hard to find in Copenhagen, which has keptthe rent level stable. We believe that the rent will stay levelin <strong>2010</strong>. The vacancy rate rose from 1.9% in the capitalarea to approximately 2.8%.The retail market has been severely affected by the financialcrisis and rent levels have fallen by approximately 20% inthe Copenhagen area. In the primary retail streets, thereis still no real vacancy. The vacancy has primarily hit thesecondary locations. The vacancy rate for the greaterCopenhagen area is 3%, which is expected to increaseslightly in <strong>2010</strong>.The demand for properties in general, is still very low due tofinancial uncertainty. Even a very low interest rate has nothelped much. Yields in general have increased. Distressedproperties have, on many occasions, been bought by thebanks that have the largest securities. We are expecting theprices will find a stable level in the beginning of <strong>2010</strong>.The investment market is slowly starting to loosen up andduring 2009 there have been a few large transactions. Thepension funds are willing to buy at competitive levels, but thecore properties they are targeting are very scarce.Contact<strong>NAI</strong> Premises+358 46 712 2197Country DataArea (KM 2 )GDP Growth (%)GDP 2009 (US$ B)GDP/Capita (US$)Inflation Rate (%)UnemploymentRate (%)338,424-7.00%$242.33$45,876.383.00%8.74%The Finnish economy seems to have reached the bottombut Finland’s recovery from the recession will take time.Finland became a victim of the global crisis mainly due toits export-driven economy while its domestic businessremained relatively healthy. Since approximately 45% ofFinnish GDP accounts from foreign trade, Finland’s recoveryis very much based on the recovery of its trade partners. Anupward turn in the Finnish economy is expected to start late<strong>2010</strong> into early 2011.During 2009 the transaction volume in the Finnish propertymarket has been very low. Reasons for this stem from pooravailability, high financing margins and the fact that sellersand buyers have a wide gap in their yield expectations. Fromits highest volume in 2007, transaction volume hasdecreased approximately 80%. At the moment, 65% ofinvestors are domestic compared to 54% in 2008 and 35%in 2007. In the Helsinki Metropolitan Area (HMA), over thespan of the past year the prime office yield level has risenfrom 5% to 6%. During the past year, more than 400,000SM of new office space has been completed in the HMAarea. This has increased the vacancy rates almost 40%compared to last year’s figures. At the same time, rents havedecreased, which has affected Net Operating Income atthe property level and decreased transaction volumes. Thecurrent vacancy rate for 2009 in HMA is approximately6.8% compared to 4.6% in 2008.The past year was not without significant transactions. InQ1 Google bought an old paper industry property from StoraEnso for €40,000,000. In Q2, Etera Mutual Pension InsuranceCompany sold its office properties, Swing Life ScienceCenter, for €120,000,000 to Fund of Commerz <strong>Real</strong> AG. InQ3, Finnair Facilities Management made a sale-leasebacktransaction and sold its properties for €77,000.000 to NVProperty Fund I.Unemployment has been relatively low during the past severalyears due to the strong growth of the Finnish economy.While the employment rate was near 6.4% in 2008, it isexpected to increase to almost 10% in <strong>2010</strong> based on theGDP’s 1% growth in 2008 versus the prediction of -7%growth in 2009.Interest Rate(%)1.00%Interest Rate(%)1.00%Population (Millions)5.511Population (Millions) 5.34Copenhagen At A GlanceConversion: 5.4824 DKK = 1 US$ RENT/M 2 /YR US$ RENT/SF/YRLow High Low High VacancyCENTER CITY OFFICENew Construction (AAA)Class A (Prime)Class B (Secondary)SUBURBAN OFFICENew Construction (AAA)Class A (Prime)DKK 1,300.00DKK 1,200.00DKK 700.00DKK 900.00DKK 850.00DKK 1,900.00DKK 1,700.00DKK 1,000.00DKK 1,300.00DKK 1,100.00$ 22.03$ 20.33$ 11.86$ 15.25$ 14.40$$$$$32.2028.8116.9522.0318.645.0%4.7%7.0%5.0%5.0%Class B (Secondary)INDUSTRIALBulk WarehouseManufacturingHigh Tech/R&DRETAILDKK 500.00DKK 350.00DKK 350.00DKK 400.00DKKDKKDKKDKK850.00600.00600.00650.00$$$$8.475.935.936.78$$$$14.4010.1710.1711.016.5%2.5%3.0%2.5%DowntownDKK 3,500.00 DKK 15,000.00 $ 59.31 $ 254.18 1.3%Neighborhood Service Centers DKK 900.00 DKK 2,500.00 $ 15.25 $ 42.36 4.5%Community Power CenterDKK 1,000.00 DKK 2,200.00 $ 16.95 $ 37.28 3.0%Regional MallsSolus Food StoresDKKDKK100.00900.00DKK 2,200.00DKK 1 ,500.00$ 16.95$ 15.25$$37.2825.423.0%1.5%DEVELOPMENT LAND Low/M 2 High/M 2 Low/SF High/SFOffice in CBDLand in Office ParksLand in Industrial ParksOffice/Industrial Land - Non-parkRetail/<strong>Commercial</strong> LandResidentialDKK 1,800.00 DKK 4,000.00 $ 30.50 $ 67.78DKK 1,500.00 DKK 3,500.00 $ 25.42 $ 59.31DKK 1,200.00 DKK 3,000.00 $ 20.33 $ 50.84DKK 1,500.00 DKK 2,750.00 $ 25.42 $ 46.60DKK 1,800.00 DKK 4,000.00 $ 30.50 $ 67.78DKK 1,000.00 DKK 3,000.00 $ 16.95 $ 50.84Finland At A GlanceConversion: .793 EUR = 1 US$ RENT/M 2 /MO US$ RENT/SF/YRLow High Low High VacancyCITY CENTER OFFICENew Construction (AAA)Class A (Prime)Class B (Secondary)SUBURBAN OFFICENew Construction (AAA)Class A (Prime)Class B (Secondary)INDUSTRIALBulk Warehouse€€€€€€€22.0022.0017.0017.0015.009.006.00€€€€€€€27.0027.0021.0019.0018.0014.007.50$$$$$$$30.9330.9323.9023.9021.0912.658.44$ 37.96$ 37.96$ 29.52$ 26.71$ 25.31$ 19.68$ 10.54N/A4.7%6.2%10.5%11.1%14.0%5.3%Manufacturing€ 5.00 € 7.00 $ 7.03 $ 9.84 5.3%High Tech/R&DRETAIL€ 6.00 € 8.00 $ 8.44 $ 11.25 5.3%Downtown€ 25.00 € 140.00 $ 35.15 $ 196.82 2.3%Neighborhood Service CentersCommunity Power CenterRegional MallsSolus Food Stores€€€€11.0011.0011.009.00€€€€40.0040.0040.0016.00$$$$15.4615.4615.4615.46$ 56.23$ 56.23$ 56.23$ 56.232.8%2.9%2.9%3.0%DEVELOPMENT LAND Low/M 2 High/M 2 Low/SF High/SFOffice in CBDLand in Office ParksLand in Industrial ParksOffice/Industrial Land - Non-parkRetail/<strong>Commercial</strong> LandResidentialN/A N/A N/A N/A€ 275.00 € 500.00 $ 346.78 $ 630.52€ 175.00 € 300.00 $ 220.68 $ 378.31€ 225.00 € 275.00 $ 283.73 $ 346.78€ 250.00 € 400.00 $ 315.26 $ 504.41€ 250.00 € 600.00 $ 315.26 $ 756.62<strong>2010</strong> <strong>Global</strong> <strong>Market</strong> <strong>Report</strong> ■ www.naiglobal.com 45
Paris - lle de France (Paris Region), FranceContact<strong>NAI</strong> Evolis+33 1 81 72 00 00Country DataArea (KM 2 )GDP Growth (%)GDP 2009 (US$ B)GDP/Capita (US$)Inflation Rate (%)UnemploymentRate (%)Interest Rate(%)1334.3-2.36%$2,634.82$42,091.330.34%9.54%1.00%Population (Millions) 62.598Despite technical factors such as the impact of companiesrestocking their inventories or the ramp-up of governmentstimulus packages, the French government has maintainedits prediction that the economy in France will not emergefrom recession until sometime in <strong>2010</strong>. The employmentmarket suffers of this context, in particular in Greater Paris.The real estate market has been hit hard by this challengingeconomic environment. Adding to the difficulties is investmentactivity hit by the freeze in the volume of capital committedfollowing the onset of the financial crisis, ongoing tight creditconditions, hesitancy among market players and the persistentgap between appraisal values and market values.Office property accounted for 53% of total investments comparedto 80% during the peak in the investment cycle.A total of 1.8 million SM is expected to enter Greater Parisin 2009, which is 36% less than 2008. This level of take-upshould remain stable in <strong>2010</strong>. Demand for office space wasstifled by worsening employment conditions and deterioratingcorporate balance sheets. Furthermore, many tenants optedto renegotiate their leases rather than move to cheaperpremises.An exception has been the public sector, which was veryactive, led by 22,000 SM of office space leased by SNCF(national train company) in the CNIT in La Défense. This wasthe largest transaction of the year. On the supply side, thearrival on the market of a significant volume of new officespace launched in 2007 contributed to an increase in theoffice stock that is expected to reach 5 million SM at theend of the year. This would represent a vacancy rate of 8%by the end of 2009.The <strong>2010</strong> French real estate market should look nearly thesame as in 2009, even with expectations that the investmentmarket will recover thanks to an adjustment betweenseller prices and buyer expectations.Paris At A GlanceConversion: 0.6727 € = 1 US$ RENT/M 2 /YR US$ RENT/SF/YRLow High Low High VacancyCITY CENTER OFFICENew Construction (AAA)Class A (Prime)Class B (Secondary)SUBURBAN OFFICENew Construction (AAA)€€€€550.00420.00250.00180.00€€€€700.00600.00450.00320.00$$$$75.9658.0034.5324.86$$$$96.6782.8662.1544.196.5%6.0%6.5%8.0%Class A (Prime)Class B (Secondary)INDUSTRIALBulk WarehouseManufacturingHigh Tech/R&DRETAIL€€€€€150.00120.0045.0055.0050.00€€€€€250.00200.0050.0075.00130.00$$$$$20.7216.576.216.216.91$$$$$34.53 10.0%27.62 11.0%6.91 N/A6.91 N/A17.95 N/ACity Center€ 7,500.00 € 10,500.00 $1,035.78 $1,450.09 N/ARetail Units in ParksCommunity Power Center (Big Box)Regional Shopping Centers/MallsSolus Food Stores€€170.00N/A150.00N/A€€190.00N/A180.00N/A$$23.48N/A20.72N/A$$26.24N/A24.86N/AN/AN/AN/AN/ADEVELOPMENT LAND Low/M 2 High/M 2 Low/SF High/SFOffice in CBDLand in Office ParksLand in Industrial ParksOffice/Industrial Land - Non-parkRetail/<strong>Commercial</strong> LandResidentialN/A N/A N/A N/AN/A N/A N/A N/AN/A N/A N/A N/AN/A N/A N/A N/AN/A N/A N/A N/AN/A N/A N/A N/AFrankfurt am Main, GermanyContact<strong>NAI</strong> apollo+49 69 970 50 50Country DataArea (KM 2 )GDP Growth (%)GDP 2008 (US$ B)GDP/Capita (US$)Inflation Rate (%)UnemploymentRate (%)356,8541.93,818.4746,498.652.98.0Population (Millions) 82.1Frankfurt am Main At A GlanceConversion: .793 EUR = 1 US$ RENT/M 2 /YR US$ RENT/SF/MOLow High Low High VacancyCITY CENTER OFFICEClass A (Prime)Class B (Secondary)Average City CenterSUBURBAN OFFICEWestend Class A (Prime)Westend Class B (Secondary)Suburban Class A (Prime)Suburban Class B (Secondary)INDUSTRIAL€€€€€€€270.00147.00225.00252.00162.00150.00138.00€€€€€€€471.00234.00360.00456.00288.00192.00150.00$ 35.83$ 19.51$ 29.86$ 33.44$ 21.50$ 19.91$ 18.32$$$$$$$62.5131.0647.7860.5238.2225.4819.9114.09%14.09%14.09%14.09%14.09%14.09%N/ABulk WarehouseManufacturingHigh Tech/R&DRETAIL€€€42.0048.0054.00€€€81.0081.00180.00$$$5.576.377.17$$$10.7510.7523.89N/AN/AN/AZeil (Prime Shop Units)Goethe Strasse (Prime Shop Units)€ 2,400.00€ 1,470.00€ 3,120.00€ 2,640.00$ 318.52$195.09$ 414.08$ 350.37N/AN/ACommunity Power Center (Big Box)Regional Centers/MallsSolus Food Stores€€€96.0096.00144.00€€€180.00180.0092.00$ 12.74$ 12.74$ 19.11$$$23.8923.8925.48N/AN/AN/ADEVELOPMENT LAND Low/M 2 High/M 2 Low/SF High/SFOffice in CBDLand in Office ParksLand in Industrial ParksOffice/Industrial Land - Non-parkRetail/<strong>Commercial</strong> LandResidentialThe German market seems to be overcoming the crisisfaster than anticipated. GDP for <strong>2010</strong> will increase by0.75%. Unemployment is at 8.0%, up from 7.4% in 2008with an increase expected in <strong>2010</strong>. The real estate marketshows falling prices and modest levels of activity in mostsectors.For many companies, the weak economy, combinedwith the ongoing restrictive loan environment, represents athreat to their very existence. These factors continue toimpact demand in all real estate sectors. A clear recoveryin the market is unlikely in the next six to nine months. Ifimprovement in the global economic situation is sustained,the real estate market should show a slight improvement inQ3 <strong>2010</strong>, and then move laterally for a year or two.The investment market saw weakened demand frominvestors during the first half of 2009, which impactedinvestment volume in the most important German businesscenters: Berlin, Düsseldorf, Frankfurt, Hamburg, Munich andStuttgart. Transaction volume dropped almost 65% to €715million, down from €2 billion in 2008. Prime yields were5.5%, up from 4.6% in 2008. Prime property prices havefallen by 17% reflecting the weakening demand for officespace and the resultant increase in vacancy with ratespredicted to increase.Leased office space in Frankfurt in the first nine months wasapproximately 273,000 SM, a 30% decrease from 395,000SM in 2008. Locations with the highest demand includedthe financial district/trade fair district with 125,132 SM, thecity center/railway station at 20,330 SM and the CityWest/Bockenheim area at 18,526 SM. Roughly 340,000SM is forecast to be absorbed in the market in 2009.New development and refurbishments in the first six monthsof 2009 were at 100,450 SM up from 92,000 SM in 2008.A decline is expected for <strong>2010</strong> and 2011 due to financeproblems for projects without pre-leasing. Prime rent is at€34.00/SM/month, down from €42.00/SM/month in 2008.Average rent is at €16.00/SM/month, down from€21.50/SM/month in 2008. The vacancy rate is 14.4% with1,699,000 SM, slightly up from 1,650,000 SM in 2008.The industrial market in Frankfurt and surrounding areasleased approximately 225,000 SM in the first nine months.Prime rents were at €6.00/SM/month and the average rentwas €4.50/SM/month, both unchanged from 2008. The2009 forecast for absorption is approximately 250,000-300,000 SM.€ 3,000.00 € 19,600.00 $ 398.15 $ 2,601.26€ 400.00 € 1,000.00 $ 53.09 $ 132.72€ 160.00 € 250.00 $ 21.23 $ 33.18€ 170.00 € 250.00 $ 22.56 $ 33.18€ 180.00 € 250.00 $ 23.89 $ 33.18€ 500.00 € 1,000.00 $ 66.36 $ 132.72<strong>2010</strong> <strong>Global</strong> <strong>Market</strong> <strong>Report</strong> ■ www.naiglobal.com46
- Page 1 and 2: CommercialCommercial Real Estate Se
- Page 3 and 4: ■ ■ ■ Table of ContentsGENERA
- Page 5 and 6: Global OutlookCommercial real estat
- Page 7 and 8: 38.3% in November 2009. At the same
- Page 9 and 10: quality than the Census properties.
- Page 11 and 12: SaskatchewanSaskatchewan is a small
- Page 13 and 14: As 2009 draws to a close, there is
- Page 15 and 16: Global investment interest largely
- Page 18 and 19: ChinaChina continued to post large
- Page 20 and 21: MalaysiaWith Malaysia’s dependenc
- Page 22 and 23: ■ US Highlights - Northeast Regio
- Page 24 and 25: ■ US Highlights - Midwest Region
- Page 26 and 27: ■ US Highlights - West Region■
- Page 28 and 29: Melbourne, AustraliaBeijing, ChinaC
- Page 30 and 31: Shanghai, ChinaXiamen, ChinaContact
- Page 32 and 33: Delhi, Gurgaon, IndiaHyderabad, Pra
- Page 34 and 35: Punjab, IndiaTokyo, JapanContactNAI
- Page 36 and 37: Seoul, South KoreaTaipei, TaiwanCon
- Page 38 and 39: Calgary, Alberta, CanadaEdmonton, A
- Page 40 and 41: Halifax, Nova Scotia, CanadaOttawa,
- Page 42 and 43: Regina, Saskatchewan, CanadaContact
- Page 44 and 45: Vienna, AustriaThe Baltics (Latvia/
- Page 48 and 49: Athens, GreeceReykjavik IcelandCont
- Page 50 and 51: KuwaitOslo, NorwayContactNAI Kuwait
- Page 52 and 53: Moscow, Russian FederationSt. Peter
- Page 54 and 55: Madrid, SpainStockholm, SwedenConta
- Page 56 and 57: Istanbul, TurkeyKiev, UkraineContac
- Page 58 and 59: Latin AmericaSECTION CONTENTSBuenos
- Page 60 and 61: Campinas, BrazilCuritiba, BrazilCon
- Page 62 and 63: Sao Paulo, BrazilSantiago, ChileCon
- Page 64 and 65: Ciudad Juarez, Chihuahua, MexicoGua
- Page 66 and 67: Matamoros, Tamaulipas, MexicoMexica
- Page 68 and 69: Reynosa, MexicoSaltillo, Coahuila,
- Page 70 and 71: Torreon, Coahulia, MexicoCaracas, V
- Page 72 and 73: Birmingham, AlabamaHuntsville, Deca
- Page 74 and 75: Jonesboro, ArkansasLittle Rock, Ark
- Page 76 and 77: Marin County, CaliforniaMonterey, C
- Page 78 and 79: Sacramento, CaliforniaSan Diego, Ca
- Page 80 and 81: Santa Clara County (Silicon Valley)
- Page 82 and 83: Colorado Springs, ColoradoDenver, C
- Page 84 and 85: Fort Lauderdale, FloridaFt. Myers/N
- Page 86 and 87: Miami, FloridaOrlando, FloridaConta
- Page 88 and 89: Atlanta, GeorgiaHonolulu, HawaiiCon
- Page 90 and 91: Chicago, IllinoisSpringfield, Illin
- Page 92 and 93: Cedar Rapids, Iowa City, IowaDavenp
- Page 94 and 95: Wichita, KansasLexington, KentuckyC
- Page 96 and 97:
Monroe, LouisianaNew Orleans, Louis
- Page 98 and 99:
Suburban MarylandBoston, Massachuse
- Page 100 and 101:
Grand Rapids, MichiganLansing, Mich
- Page 102 and 103:
St. Louis, MissouriBozeman, Montana
- Page 104 and 105:
Omaha, NebraskaLas Vegas, NevadaCon
- Page 106 and 107:
Portsmouth, New HampshireAtlantic C
- Page 108 and 109:
Ocean/Monmouth Counties (“Shore M
- Page 110 and 111:
Las Cruces, New MexicoAlbany, New Y
- Page 112 and 113:
Asheville, North CarolinaCharlotte,
- Page 114 and 115:
Fargo, North DakotaAkron, OhioConta
- Page 116 and 117:
Cleveland, OhioColumbus, OhioContac
- Page 118 and 119:
Tulsa, OklahomaPortland, OregonCont
- Page 120 and 121:
Bucks County, PennsylvaniaHarrisbur
- Page 122 and 123:
Pittsburgh, PennsylvaniaSchuylkill
- Page 124 and 125:
Greenville/Spartanburg/Anderson Cou
- Page 126 and 127:
Knoxville, TennesseeMemphis, Tennes
- Page 128 and 129:
Beaumont, TexasCorpus Christi, Texa
- Page 130 and 131:
Fort Worth, TexasHouston, TexasCont
- Page 132 and 133:
Texarkana (Bowie County, Texas/Mill
- Page 134 and 135:
Northern VirginiaSeattle/Puget Soun
- Page 136 and 137:
Madison, WisconsinMilwaukee, Wiscon
- Page 138 and 139:
Jackson Hole, WyomingContactNAI Jac
- Page 140:
Build on the power of our network.N


