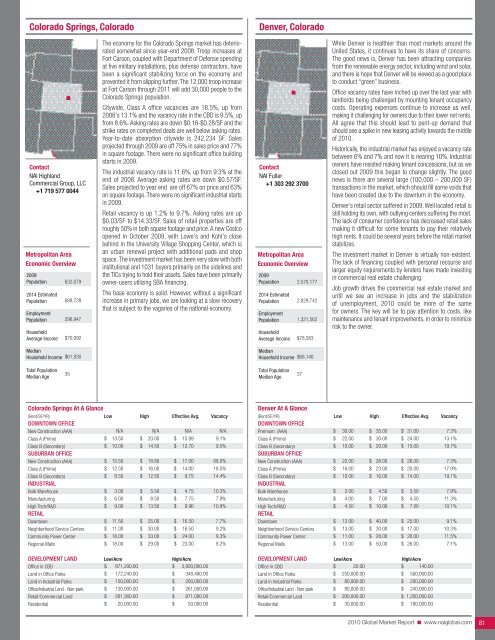
Colorado Springs, ColoradoDenver, ColoradoContact<strong>NAI</strong> Highland<strong>Commercial</strong> Group, LLC+1 719 577 0044Metropolitan AreaEconomic Overview2009Population2014 EstimatedPopulationEmploymentPopulationHouseholdAverage Income632,079688,728298,947$70,092The economy for the Colorado Springs market has deterioratedsomewhat since year-end 2008. Troop increases atFort Carson, coupled with Department of Defense spendingat five military installations, plus defense contractors, havebeen a significant stabilizing force on the economy andprevented it from slipping further. The 12,000 troop increaseat Fort Carson through 2011 will add 30,000 people to theColorado Springs population.Citywide, Class A office vacancies are 18.5%, up from2008's 13.1% and the vacancy rate in the CBD is 9.5%, upfrom 8.6%. Asking rates are down $0.18-$0.28/SF and thestrike rates on completed deals are well below asking rates.Year-to-date absorption citywide is 242,234 SF. Salesprojected through 2009 are off 75% in sales price and 77%in square footage. There were no significant office buildingstarts in 2009.The industrial vacancy rate is 11.6%, up from 9.3% at theend of 2008. Average asking rates are down $0.57/SF.Sales projected to year end are off 67% on price and 63%on square footage. There were no significant industrial startsin 2009.Retail vacancy is up 1.2% to 9.7%. Asking rates are up$0.03/SF to $14.33/SF. Sales of retail properties are offroughly 50% in both square footage and price. A new Costcoopened in October 2009, with Lowe's and Kohl's closebehind in the University Village Shopping Center, which isan urban renewal project with additional pads and shopspace. The investment market has been very slow with bothinstitutional and 1031 buyers primarily on the sidelines andthe TICs trying to hold their assets. Sales have been primarilyowner-users utilizing SBA financing.The base economy is solid. However, without a significantincrease in primary jobs, we are looking at a slow recoverythat is subject to the vagaries of the national economy.Contact<strong>NAI</strong> Fuller+1 303 292 3700Metropolitan AreaEconomic Overview2009Population2014 EstimatedPopulationEmploymentPopulationHouseholdAverage Income2,570,1772,829,7421,321,562$78,583While Denver is healthier than most markets around theUnited States, it continues to have its share of concerns.The good news is, Denver has been attracting companiesfrom the renewable energy sector, including wind and solar,and there is hope that Denver will be viewed as a good placeto conduct “green” business.Office vacancy rates have inched up over the last year withlandlords being challenged by mounting tenant occupancycosts. Operating expenses continue to increase as well,making it challenging for owners due to their lower net rents.All agree that this should lead to pent-up demand thatshould see a spike in new leasing activity towards the middleof <strong>2010</strong>.Historically, the industrial market has enjoyed a vacancy ratebetween 6% and 7% and now it is nearing 10%. Industrialowners have resisted making tenant concessions, but as weclosed out 2009 this began to change slightly. The goodnews is there are several large (100,000 – 200,000 SF)transactions in the market, which should fill some voids thathave been created due to the downturn in the economy.Denver’s retail sector suffered in 2009. Well located retail isstill holding its own, with outlying centers suffering the most.The lack of consumer confidence has decreased retail salesmaking it difficult for some tenants to pay their relativelyhigh rents. It could be several years before the retail marketstabilizes.The investment market in Denver is virtually non-existent.The lack of financing coupled with personal recourse andlarger equity requirements by lenders have made investingin commercial real estate challenging.Job growth drives the commercial real estate market anduntil we see an increase in jobs and the stabilizationof unemployment, <strong>2010</strong> could be more of the samefor owners. The key will be to pay attention to costs, likemaintenance and tenant improvements, in order to minimizerisk to the owner.MedianHousehold Income$61,930MedianHousehold Income$68,140Total PopulationMedian Age35Total PopulationMedian Age37Colorado Springs At A Glance(Rent/SF/YR) Low High Effective Avg. VacancyDOWNTOWN OFFICENew Construction (AAA)Class A (Prime)Class B (Secondary)SUBURBAN OFFICENew Construction (AAA)Class A (Prime)Class B (Secondary)INDUSTRIALBulk WarehouseManufacturingHigh Tech/R&DRETAILDowntownNeighborhood Service CentersCommunity Power CenterRegional Malls$$$$$$$$$$$$N/A13.5010.0015.5012.508.503.006.009.0011.5011.0018.0018.00$$$$$$$$$$$$N/A20.0014.5018.8016.0012.505.508.5013.5025.0030.0033.0029.00$$$$$$$$$$$$N/A15.9912.7017.0014.009.754.757.759.9616.5016.5024.0023.00N/A9.1%9.5%68.0%18.5%14.4%10.3%7.9%10.9%7.7%9.2%9.3%8.2%DEVELOPMENT LAND Low/Acre High/AcreOffice in CBDLand in Office ParksLand in Industrial ParksOffice/Industrial Land - Non-parkRetail/<strong>Commercial</strong> LandResidential$$$$$$871,200.00172,240.00150,000.00130,000.00261,360.0020,000.00$$$$$$3,800,000.00348,480.00200,000.00261,000.00871,000.0050,000.00Denver At A Glance(Rent/SF/YR) Low High Effective Avg. VacancyDOWNTOWN OFFICEPremium (AAA)Class A (Prime)Class B (Secondary)SUBURBAN OFFICENew Construction (AAA)Class A (Prime)Class B (Secondary)INDUSTRIAL$$$$$$30.0022.0010.0022.0016.0010.00$$$$$$35.0030.0020.0028.0023.0016.00$ 31.00$ 24.00$ 15.00$ 26.00$ 20.00$ 14.007.3%13.1%19.7%7.3%17.9%19.1%Bulk WarehouseManufacturingHigh Tech/R&DRETAIL$$$2.004.004.50$$$4.507.0010.00$$$3.504.507.007.9%11.3%10.1%DowntownNeighborhood Service CentersCommunity Power CenterRegional Malls$$$$12.0013.0011.0013.00$$$$40.0030.0028.0050.00$ 25.00$ 17.00$ 20.00$ 26.009.1%10.3%11.5%7.1%DEVELOPMENT LAND Low/Acre High/AcreOffice in CBDLand in Office ParksLand in Industrial ParksOffice/Industrial Land - Non-park$$$$20.00250,000.0080,000.0080,000.00$$$$140.00500,000.00200,000.00240,000.00Retail/<strong>Commercial</strong> Land$ 200,000.00 $ 1,200,000.00Residential$ 30,000.00 $ 180,000.00<strong>2010</strong> <strong>Global</strong> <strong>Market</strong> <strong>Report</strong> ■ www.naiglobal.com 81
Delaware & Cecil County, MarylandWashington D.C.Contact<strong>NAI</strong> Emory Hill+1 302 322 9500Metropolitan AreaEconomic Overview2009Population2014 EstimatedPopulationEmploymentPopulationHouseholdAverage IncomeMedianHousehold IncomeTotal PopulationMedian Age365,831431,861175,945$62,172$48,29739Wilmington’s vacancy rate increased in 2009 while absorptionrates decreased. Local developers have acquiredexisting assets and have completed new construction, muchof which has remained vacant. Suburban office vacanciesrose sharply in 2009 while suburban development willcontinue with moderate pre-leasing activity. Industrial activityin New Castle County has been slow.Bank of America continues to consolidate into Wilmington’sCBD, bringing 500,000 SF of suburban office online. ClassB is forecasted to lease quickly as it has shown moderateactivity and net absorption throughout 2009. Suburbanoffice availability remains below the national average andhas stabilized for Class A and Class B properties. Class Arates dropped while vacancy rose, with a reduction in ClassB rates driven by increased sublease space. Developmentsites in Middletown and Newark represent an additional200,000 SF. Absorption and lease rates are expected toremain constant during early <strong>2010</strong>. Medical office commandsthe highest rental rates and land prices remain unchangedfrom 2007.Since 2002, nearly 2.5million SF of industrial had beenabsorbed by automakers. In 2008, both Chrysler’s Newarkplant and Saturn’s New Castle plant closed. The Universityof Delaware purchased the Newark plant. Fisker Automotivepurchased the New Castle plant, where they will assemblea hybrid sedan. Industrial land absorption is expected toremain stagnant through <strong>2010</strong>.Most of Delaware's new retail construction is mixed-usewith some strip centers in Northern Delaware opting foradditions and renovations. New construction is strongestaround the Christiana area. Southern Delaware continuesto see growth. Future development around Route 273 andChristiana Mall will bring nearly 2 million SF online in thenext few years.Cecil County, Maryland, has experienced increased industrialactivity due to aggressive county initiatives. Base <strong>Real</strong>ignmentAnd Closure, which will transfer operations from FortMonmouth to Aberdeen Proving Ground in 2011, is affectingCecil County as new residents are relocating to the area.Accordingly, industrial interest remains strong throughoutthe county.Contact<strong>NAI</strong> KLNB, LLC+1 202 375 7500Metropolitan AreaEconomic Overview2009Population2014 EstimatedPopulationEmploymentPopulationHouseholdAverage IncomeMedianHousehold IncomeTotal PopulationMedian Age5,331,7755,398,3122,934,389$109,029$81,00137The Washington, DC, retail market experienced a declinein market conditions over 2009. However, the stimuluspackage has had a positive impact on the overall real estatemarket in Metropolitan Washington, DC, with several GSAleases signed during the year. The Recovery Act group itselfcompleted a lease for 12,000 SF at 1717 PennsylvaniaAvenue and Troubled Asset Relief Program (TARP) signedanother lease for 70,000 SF at 1801 L Street.The amount of vacant office space in the Washington markethas trended up over the past four quarters. At the end of2008, there was 395,912 SF of vacant sublease space.Currently, there is 447,301 SF vacant in the market. Moreof the same is expected for the balance of 2009 andthe beginning of <strong>2010</strong>, but things could change quickly ifdemand shows any signs of recovery. With over 2 millionSF still scheduled to deliver in 2009, and an additional3.8 million scheduled for <strong>2010</strong>, an easy prediction is anincrease in the vacancy rate through <strong>2010</strong>. However,a potential tightening of supply may occur within the CBDduring the first half of <strong>2010</strong>. Less than 850,000 SFexpected to be delivered, is located inside the CBD anddevelopment in the retail sector is still doing well.In the area locally referred to as NoMa (north of MassachusettsAvenue), the multi-faceted Constitution Square, whichconsists of approximately 1.6 million SF of space, is underconstruction with the retail section anchored by a new urbanHarris Teeter grocery store. The first delivery of space isexpected to occur at the end of <strong>2010</strong>. In addition, ForestCity is building The Yards adjacent to Nationals Park. Morethan 400,000 SF of retail space and 2,800 residential unitsare planned.If employers slow the pace of job loss and the effects of thestimulus package continue, the District could see several ofits submarkets begin to tighten in <strong>2010</strong>.Delaware & Cecil County, Maryland At A Glance(Rent/SF/YR) Low High Effective Avg. VacancyDOWNTOWN OFFICENew Construction (AAA)Class A (Prime)Class B (Secondary)SUBURBAN OFFICENew Construction (AAA)Class A (Prime)Class B (Secondary)INDUSTRIALBulk WarehouseManufacturingHigh Tech/R&DRETAILDowntownNeighborhood Service CentersCommunity Power CenterRegional Malls$$$$$$$$$$$$26.0026.0013.0024.0022.0015.503.50N/A10.0012.0018.0019.5055.00$$$$$$$$$$$$30.0028.0019.0028.0028.5019.007.00N/A20.0018.0023.0027.0075.00$$$$$$$$$$$$27.5026.0018.5026.0022.5018.504.25N/A14.0013.2520.0021.0060.0025.0%20.0%35.0%15.0%20.0%30.0%20.0%N/A18.0%10.0%15.0%10.0%5.0%DEVELOPMENT LAND Low/Acre High/AcreOffice in CBD$ 40.00 $ 75.00Land in Office ParksLand in Industrial ParksOffice/Industrial Land - Non-parkRetail/<strong>Commercial</strong> LandResidential$$$$$300,000.00175,000.00150,000.00300,000.0035,000.00$$$$$550,000.00220,000.00450,000.00550,000.00225,000.00Washington DC At A Glance(Rent/SF/YR) Low High Effective Avg. VacancyDOWNTOWN OFFICENew Construction (AAA)Class A (Prime)Class B (Secondary)SUBURBAN OFFICENew Construction (AAA)Class A (Prime)Class B (Secondary)INDUSTRIALBulk WarehouseManufacturingHigh Tech/R&DRETAILDowntownNeighborhood Service CentersCommunity Power CenterRegional Malls$$$$$$$$$46.0035.0028.00N/AN/AN/A5.00N/A9.0025.0020.0015.0035.00$ 70.00$ 70.00$ 50.00N/AN/AN/A$ 16.00N/A$ 18.00$ 80.00$ 45.00$ 40.00$ 90.00$$$$$$$$$58.0051.0041.00N/AN/AN/A9.50N/A16.0055.0030.0020.0062.00N/A14.0%11.0%N/AN/AN/A16.0%N/A23.0%2.5%3.0%N/AN/ADEVELOPMENT LAND Low/Acre High/AcreOffice in CBDLand in Office ParksLand in Industrial ParksOffice/Industrial Land - Non-parkRetail/<strong>Commercial</strong> LandResidential$$2,600,000.00N/AN/AN/A2,600,000.00N/A$$96,000,000.00N/AN/AN/A96,000,000.00N/A<strong>2010</strong> <strong>Global</strong> <strong>Market</strong> <strong>Report</strong> ■ www.naiglobal.com 82
- Page 1 and 2:
CommercialCommercial Real Estate Se
- Page 3 and 4:
■ ■ ■ Table of ContentsGENERA
- Page 5 and 6:
Global OutlookCommercial real estat
- Page 7 and 8:
38.3% in November 2009. At the same
- Page 9 and 10:
quality than the Census properties.
- Page 11 and 12:
SaskatchewanSaskatchewan is a small
- Page 13 and 14:
As 2009 draws to a close, there is
- Page 15 and 16:
Global investment interest largely
- Page 18 and 19:
ChinaChina continued to post large
- Page 20 and 21:
MalaysiaWith Malaysia’s dependenc
- Page 22 and 23:
■ US Highlights - Northeast Regio
- Page 24 and 25:
■ US Highlights - Midwest Region
- Page 26 and 27:
■ US Highlights - West Region■
- Page 28 and 29:
Melbourne, AustraliaBeijing, ChinaC
- Page 30 and 31:
Shanghai, ChinaXiamen, ChinaContact
- Page 32 and 33: Delhi, Gurgaon, IndiaHyderabad, Pra
- Page 34 and 35: Punjab, IndiaTokyo, JapanContactNAI
- Page 36 and 37: Seoul, South KoreaTaipei, TaiwanCon
- Page 38 and 39: Calgary, Alberta, CanadaEdmonton, A
- Page 40 and 41: Halifax, Nova Scotia, CanadaOttawa,
- Page 42 and 43: Regina, Saskatchewan, CanadaContact
- Page 44 and 45: Vienna, AustriaThe Baltics (Latvia/
- Page 46 and 47: Copenhagen, DenmarkFinlandContactNA
- Page 48 and 49: Athens, GreeceReykjavik IcelandCont
- Page 50 and 51: KuwaitOslo, NorwayContactNAI Kuwait
- Page 52 and 53: Moscow, Russian FederationSt. Peter
- Page 54 and 55: Madrid, SpainStockholm, SwedenConta
- Page 56 and 57: Istanbul, TurkeyKiev, UkraineContac
- Page 58 and 59: Latin AmericaSECTION CONTENTSBuenos
- Page 60 and 61: Campinas, BrazilCuritiba, BrazilCon
- Page 62 and 63: Sao Paulo, BrazilSantiago, ChileCon
- Page 64 and 65: Ciudad Juarez, Chihuahua, MexicoGua
- Page 66 and 67: Matamoros, Tamaulipas, MexicoMexica
- Page 68 and 69: Reynosa, MexicoSaltillo, Coahuila,
- Page 70 and 71: Torreon, Coahulia, MexicoCaracas, V
- Page 72 and 73: Birmingham, AlabamaHuntsville, Deca
- Page 74 and 75: Jonesboro, ArkansasLittle Rock, Ark
- Page 76 and 77: Marin County, CaliforniaMonterey, C
- Page 78 and 79: Sacramento, CaliforniaSan Diego, Ca
- Page 80 and 81: Santa Clara County (Silicon Valley)
- Page 84 and 85: Fort Lauderdale, FloridaFt. Myers/N
- Page 86 and 87: Miami, FloridaOrlando, FloridaConta
- Page 88 and 89: Atlanta, GeorgiaHonolulu, HawaiiCon
- Page 90 and 91: Chicago, IllinoisSpringfield, Illin
- Page 92 and 93: Cedar Rapids, Iowa City, IowaDavenp
- Page 94 and 95: Wichita, KansasLexington, KentuckyC
- Page 96 and 97: Monroe, LouisianaNew Orleans, Louis
- Page 98 and 99: Suburban MarylandBoston, Massachuse
- Page 100 and 101: Grand Rapids, MichiganLansing, Mich
- Page 102 and 103: St. Louis, MissouriBozeman, Montana
- Page 104 and 105: Omaha, NebraskaLas Vegas, NevadaCon
- Page 106 and 107: Portsmouth, New HampshireAtlantic C
- Page 108 and 109: Ocean/Monmouth Counties (“Shore M
- Page 110 and 111: Las Cruces, New MexicoAlbany, New Y
- Page 112 and 113: Asheville, North CarolinaCharlotte,
- Page 114 and 115: Fargo, North DakotaAkron, OhioConta
- Page 116 and 117: Cleveland, OhioColumbus, OhioContac
- Page 118 and 119: Tulsa, OklahomaPortland, OregonCont
- Page 120 and 121: Bucks County, PennsylvaniaHarrisbur
- Page 122 and 123: Pittsburgh, PennsylvaniaSchuylkill
- Page 124 and 125: Greenville/Spartanburg/Anderson Cou
- Page 126 and 127: Knoxville, TennesseeMemphis, Tennes
- Page 128 and 129: Beaumont, TexasCorpus Christi, Texa
- Page 130 and 131: Fort Worth, TexasHouston, TexasCont
- Page 132 and 133:
Texarkana (Bowie County, Texas/Mill
- Page 134 and 135:
Northern VirginiaSeattle/Puget Soun
- Page 136 and 137:
Madison, WisconsinMilwaukee, Wiscon
- Page 138 and 139:
Jackson Hole, WyomingContactNAI Jac
- Page 140:
Build on the power of our network.N


