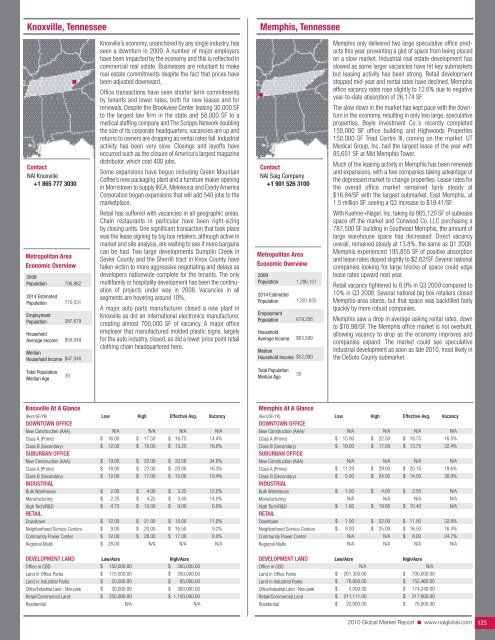
Knoxville, TennesseeMemphis, TennesseeContact<strong>NAI</strong> Knoxville+1 865 777 3030Metropolitan AreaEconomic Overview2009Population2014 EstimatedPopulationEmploymentPopulationHouseholdAverage IncomeMedianHousehold Income706,862770,531387,679$58,049$47,048Knoxville’s economy, unanchored by any single industry, hasseen a downturn in 2009. A number of major employershave been impacted by the economy and this is reflected incommercial real estate. Businesses are reluctant to makereal estate commitments despite the fact that prices havebeen adjusted downward.Office transactions have seen shorter term commitmentsby tenants and lower rates, both for new leases and forrenewals. Despite the Brookview Center leasing 30,000 SFto the largest law firm in the state and 58,000 SF to amedical staffing company and The Scripps Network doublingthe size of its corporate headquarters, vacancies are up andreturns to owners are dropping as rental rates fall. Industrialactivity has been very slow. Closings and layoffs haveoccurred such as the closure of America’s largest magazinedistributor, which cost 400 jobs.Some expansions have begun including Green MountainCoffee’s new packaging plant and a furniture maker openingin Morristown to supply IKEA. Meleleuca and Exedy AmericaCorporation began expansions that will add 540 jobs to themarketplace.Retail has suffered with vacancies in all geographic areas.Chain restaurants in particular have been right-sizingby closing units. One significant transaction that took placewas the lease signing by big box retailers, although active inmarket and site analysis, are waiting to see if more bargainscan be had. Two large developments Dumplin Creek inSevier County and the Sherrill tract in Knox County havefallen victim to more aggressive negotiating and delays asdevelopers nationwide complete for the tenants. The onlymultifamily or hospitality development has been the continuationof projects under way in 2008. Vacancies in allsegments are hovering around 10%.A major auto parts manufacturer closed a new plant inKnoxville as did an international electronics manufacturer,creating almost 700,000 SF of vacancy. A major officeemployer that manufactured molded plastic signs, largelyfor the auto industry, closed, as did a lower price point retailclothing chain headquartered here.Contact<strong>NAI</strong> Saig Company+1 901 526 3100Metropolitan AreaEconomic Overview2009Population2014 EstimatedPopulationEmploymentPopulationHouseholdAverage IncomeMedianHousehold Income1,286,1511,301,835679,256$63,599$52,090Memphis only delivered two large speculative office productsthis year, preventing a glut of space from being placedon a slow market. Industrial real estate development hasslowed as some larger vacancies have hit key submarketsbut leasing activity has been strong. Retail developmentstopped mid-year and rental rates have declined. Memphisoffice vacancy rates rose slightly to 12.6% due to negativeyear-to-date absorption of 26,174 SF.The slow down in the market has kept pace with the downturnin the economy, resulting in only two large, speculativeproperties, Boyle Investment Co.’s recently completed150,000 SF office building and Highwoods Properties150,000 SF Triad Centre III, coming on the market. UTMedical Group, Inc. had the largest lease of the year with85,651 SF at Mid Memphis Tower.Much of the leasing activity in Memphis has been renewalsand expansions, with a few companies taking advantage ofthe depressed market to change properties. Lease rates forthe overall office market remained fairly steady at$16.84/SF with the largest submarket, East Memphis, at1.5 million SF, seeing a Q3 increase to $19.41/SF.With Kuehne+Nagel, Inc. taking its 865,120 SF of subleasespace off the market and Conwood Co. LLC purchasing a787,500 SF building in Southeast Memphis, the amount oflarge warehouse space has decreased. Direct vacancyoverall, remained steady at 13.8%, the same as Q1 2008.Memphis experienced 195,855 SF of positive absorptionand lease rates dipped slightly to $2.62/SF. Several nationalcompanies looking for large blocks of space could edgelease rates upward next year.Retail vacancy tightened to 8.9% in Q3 2009 compared to10% in Q3 2008. Several national big box retailers closedMemphis-area stores, but that space was backfilled fairlyquickly by more robust companies.Memphis saw a drop in average asking rental rates, downto $10.98/SF. The Memphis office market is not overbuilt,allowing vacancy to drop as the economy improves andcompanies expand. The market could see speculativeindustrial development as soon as late <strong>2010</strong>, most likely inthe DeSoto County submarket.Total PopulationMedian Age39Total PopulationMedian Age35Knoxville At A Glance(Rent/SF/YR) Low High Effective Avg. VacancyDOWNTOWN OFFICENew Construction (AAA)Class A (Prime)Class B (Secondary)SUBURBAN OFFICENew Construction (AAA)Class A (Prime)Class B (Secondary)INDUSTRIALBulk WarehouseManufacturingHigh Tech/R&DRETAILDowntownNeighborhood Service CentersCommunity Power CenterRegional Malls$$$$$$$$$$$$N/A16.0012.0019.0018.0012.002.002.254.7512.009.0012.0028.00$$$$$$$$$$$N/A17.5016.0022.0022.0017.004.004.2515.0021.0020.0026.00N/A$$$$$$$$$$$N/A16.7513.2520.5020.0015.003.253.409.0015.0016.5017.00N/AN/A14.4%16.0%24.0%16.3%19.4%12.0%14.0%6.0%11.0%9.2%8.0%N/ADEVELOPMENT LAND Low/Acre High/AcreOffice in CBDLand in Office ParksLand in Industrial ParksOffice/Industrial Land - Non-park$$$$150,000.00175,000.0020,000.0030,000.00$$$$300,000.00350,000.0085,000.00300,000.00Retail/<strong>Commercial</strong> LandResidential$ 250,000.00N/A$ 1,100,000.00N/AMemphis At A Glance(Rent/SF/YR) Low High Effective Avg. VacancyDOWNTOWN OFFICENew Construction (AAA)/Class A (Prime)Class B (Secondary)SUBURBAN OFFICENew Construction (AAA)Class A (Prime)Class B (Secondary)INDUSTRIALBulk WarehouseManufacturingHigh Tech/R&DRETAILDowntownNeighborhood Service CentersCommunity Power CenterRegional Malls$$$$$$$$N/A15.0010.00N/A11.295.001.00N/A1.001.008.00N/AN/A$$$$$$$$N/A22.5017.50N/A29.0024.004.05N/A19.8022.0025.00N/AN/A$$$$$$$$$N/A18.7513.75N/A20.1514.502.55N/A10.4011.5016.508.00N/AN/A16.5%32.4%N/A19.6%30.9%N/AN/AN/A32.8%16.4%24.7%N/ADEVELOPMENT LAND Low/Acre High/AcreOffice in CBDLand in Office ParksLand in Industrial ParksOffice/Industrial Land - Non-parkRetail/<strong>Commercial</strong> LandResidential$$$$$N/A261,300.0078,000.005,000.00211,111.0022,000.00$$$$$N/A700,000.00152,460.00174,240.00217,800.0076,500.00<strong>2010</strong> <strong>Global</strong> <strong>Market</strong> <strong>Report</strong> ■ www.naiglobal.com 125
Nashville, TennesseeAustin, TexasContact<strong>NAI</strong> Nashville+1 615 850 2700Metropolitan AreaEconomic Overview2009Population2014 EstimatedPopulationEmploymentPopulationHouseholdAverage IncomeMedianHousehold Income1,649,3811,967,166842,148$69,054$55,965The cost of living in the Nashville region is 10% below thenational average due to the lower costs of housing, transportation,utilities and many tax benefits, including no stateincome tax. As a result of these economic opportunities,Nashville continues to dominate many prominent lists.Business Facilities ranked the Nashville Metro number onefor Quality of Life, number six for Best Cost of Living, andnumber nine for Economic Growth Potential while POLICOMranked Nashville number five for Economic Strength.Vacancy rates rose during 2009 for the office, industrial andretail markets and should begin to stabilize by mid <strong>2010</strong>.During the course of the year, 2.7 million SF of product wasadded to the market, which further increased the vacancyfor all sectors. Another factor in the increased vacancy isthat sublease space has risen over the course of the yearwith more than 2 million SF of space on the market. Theoffice market has witnessed some moderate gains duringthe year while industrial is still trying to recover.Retail vacancy has risen but has little sublease spaceavailable. Over the past five years, the Nashville MSA wasa landlords’ market with minimal concessions given totenants. To keep occupancies up, landlords have giventenants more concessions such as free rent and additionalTI allowance to compensate for the increase in availablenew space and sublease space they are competing against.This trend will remain in favor of the tenants until newproduct and sublease space is absorbed and the number ofchoices for tenants decreases.Notable leases in 2009 include: Nissan’s 717,000 SF leaseat Couchville Pike II; Genco’s 319,375 SF lease at 3815Logistics Way; Synnex Corporation’s 307,200 SF lease at I-24 Distribution Center 2 and Simplex Healthcare’s 91,253SF lease at Cool Springs IV.With continued fears of an unstable economy, Nashville’scommercial real estate sectors will remain shallow throughthe first half of <strong>2010</strong>. However, Nashville is in a good positionto withstand the downturn and rebound more quickly thanother markets in the US because it supports a wider arrayof industries.Contact<strong>NAI</strong> Austin+1 512 346 5180Metropolitan AreaEconomic Overview2009Population2014 EstimatedPopulationEmploymentPopulationHouseholdAverage IncomeMedianHousehold Income1,762,9152,180,846832,927$76,318$64,972Austin, the state capital of Texas, is ranked at the top of severalnational metro comparison studies, including Best City forRecession Recovery (Forbes, June 2009), Third StrongestMetro Economy in the Nation (Brookings Institution,June 2009), and the Nation’s Best City For A Fresh Start(Relocation.com, June 2009).While news is good for economic development in Austin withonly 7.2% unemployment, it has become a hindrance tocommercial property transactions by widening the bid-askgap. Sellers lock in on good news and try to wait out therecession for a higher price, while buyers hold out forcheaper deals. The lack of adequate financing remains amajor obstacle requiring buyers to pool equity to close allcash deals.The office market failed to absorb 600,000 SF in the firsthalf of 2009. Luckily almost 300,000 SF of mostly Class Aspace was absorbed in Q3. Landlords work hard to keepexisting tenants and make attractive deals through rentconcessions. The average rental rate at the end of Q3 was$25.52/SF per year.Austin’s industrial leasing inventory grew from 34.5 millionSF in 2007 to 37.9 million SF by mid-2009. A total of3.4 million SF was added in an 18-month period. Thisrepresents an increase of 10% of gross inventory. As aresult, no institutional grade product is under construction inthe Austin area and rents continue to erode.During 2009, 618,940 SF of retail was delivered, while only278,130 SF was absorbed. This resulted in average rentalrates decreasing by $2.81/SF from December of 2008 toJune of 2009.Development for the most part has come to a grinding haltacross all product types. There is a wait and see attitudeamong developers and investors. The lack of adequatefinancing has been a major obstacle, so buyers are poolingequity to close all-cash deals.Total PopulationMedian Age37Total PopulationMedian Age33Nashville At A Glance(Rent/SF/YR) Low High Effective Avg. VacancyDOWNTOWN OFFICENew Construction (AAA)Class A (Prime)Class B (Secondary)SUBURBAN OFFICENew Construction (AAA)Class A (Prime)Class B (Secondary)INDUSTRIALBulk WarehouseManufacturingHigh Tech/R&DRETAILDowntownNeighborhood Service Centers$$$$$$$$$$$28.0017.5014.0023.7517.0013.002.753.255.0012.008.75$$$$$$$$$$$31.0026.5018.5028.0029.0023.504.755.009.5032.0033.00$$$$$$$$$$$29.5022.0016.2525.8823.0018.253.754.137.2522.0020.8852.0%13.3%14.3%51.0%9.0%11.0%20.2%16.1%4.4%15.8%7.2%Sub Regional CentersRegional Malls$24.00N/A$28.00N/A$ 26.00N/A6.0%N/ADEVELOPMENT LAND Low/Acre High/AcreOffice in CBD$ 35.00 $ 70.00Land in Office ParksLand in Industrial ParksOffice/Industrial Land - Non-parkRetail/<strong>Commercial</strong> LandResidential$$$$$125,000.0040,000.0040,000.00150,000.006,000.00$$$$$750,000.00125,000.00125,000.00800,000.00800,000.00Austin At A Glance(Rent/SF/YR) Low High Effective Avg. VacancyDOWNTOWN OFFICENew Construction (AAA)Class A (Prime)Class B (Secondary)SUBURBAN OFFICENew Construction (AAA)Class A (Prime)Class B (Secondary)INDUSTRIALBulk WarehouseManufacturingHigh Tech/R&DRETAILDowntownNeighborhood Service CentersSub Regional Centers$$N/A$$$$$$$$N/A45.6234.0033.0828.003.004.206.0014.0010.0015.00$$$$$$$$$$N/A26.3021.14N/A19.5016.575.407.<strong>2010</strong>.2041.0032.0030.00$$$$$$$$$$N/A35.9627.57N/A26.2922.294.205.708.1027.5021.0022.00N/A15.1%8.8%N/A21.4%22.1%20.0%20.0%20.0%4.0%16.0%10.0%Regional Malls$22.00 $ 45.00 $ 33.50 5.0%DEVELOPMENT LAND Low/Acre High/AcreOffice in CBD$ 15.00 $ 25.00Land in Office ParksLand in Industrial ParksOffice/Industrial Land - Non-parkRetail/<strong>Commercial</strong> LandResidential$$$$$175,000.0075,000.0087,000.00218,000.0010,000.00$$$$$325,000.00150,000.00218,000.00523,000.0040,000.00<strong>2010</strong> <strong>Global</strong> <strong>Market</strong> <strong>Report</strong> ■ www.naiglobal.com 126
- Page 1 and 2:
CommercialCommercial Real Estate Se
- Page 3 and 4:
■ ■ ■ Table of ContentsGENERA
- Page 5 and 6:
Global OutlookCommercial real estat
- Page 7 and 8:
38.3% in November 2009. At the same
- Page 9 and 10:
quality than the Census properties.
- Page 11 and 12:
SaskatchewanSaskatchewan is a small
- Page 13 and 14:
As 2009 draws to a close, there is
- Page 15 and 16:
Global investment interest largely
- Page 18 and 19:
ChinaChina continued to post large
- Page 20 and 21:
MalaysiaWith Malaysia’s dependenc
- Page 22 and 23:
■ US Highlights - Northeast Regio
- Page 24 and 25:
■ US Highlights - Midwest Region
- Page 26 and 27:
■ US Highlights - West Region■
- Page 28 and 29:
Melbourne, AustraliaBeijing, ChinaC
- Page 30 and 31:
Shanghai, ChinaXiamen, ChinaContact
- Page 32 and 33:
Delhi, Gurgaon, IndiaHyderabad, Pra
- Page 34 and 35:
Punjab, IndiaTokyo, JapanContactNAI
- Page 36 and 37:
Seoul, South KoreaTaipei, TaiwanCon
- Page 38 and 39:
Calgary, Alberta, CanadaEdmonton, A
- Page 40 and 41:
Halifax, Nova Scotia, CanadaOttawa,
- Page 42 and 43:
Regina, Saskatchewan, CanadaContact
- Page 44 and 45:
Vienna, AustriaThe Baltics (Latvia/
- Page 46 and 47:
Copenhagen, DenmarkFinlandContactNA
- Page 48 and 49:
Athens, GreeceReykjavik IcelandCont
- Page 50 and 51:
KuwaitOslo, NorwayContactNAI Kuwait
- Page 52 and 53:
Moscow, Russian FederationSt. Peter
- Page 54 and 55:
Madrid, SpainStockholm, SwedenConta
- Page 56 and 57:
Istanbul, TurkeyKiev, UkraineContac
- Page 58 and 59:
Latin AmericaSECTION CONTENTSBuenos
- Page 60 and 61:
Campinas, BrazilCuritiba, BrazilCon
- Page 62 and 63:
Sao Paulo, BrazilSantiago, ChileCon
- Page 64 and 65:
Ciudad Juarez, Chihuahua, MexicoGua
- Page 66 and 67:
Matamoros, Tamaulipas, MexicoMexica
- Page 68 and 69:
Reynosa, MexicoSaltillo, Coahuila,
- Page 70 and 71:
Torreon, Coahulia, MexicoCaracas, V
- Page 72 and 73:
Birmingham, AlabamaHuntsville, Deca
- Page 74 and 75:
Jonesboro, ArkansasLittle Rock, Ark
- Page 76 and 77: Marin County, CaliforniaMonterey, C
- Page 78 and 79: Sacramento, CaliforniaSan Diego, Ca
- Page 80 and 81: Santa Clara County (Silicon Valley)
- Page 82 and 83: Colorado Springs, ColoradoDenver, C
- Page 84 and 85: Fort Lauderdale, FloridaFt. Myers/N
- Page 86 and 87: Miami, FloridaOrlando, FloridaConta
- Page 88 and 89: Atlanta, GeorgiaHonolulu, HawaiiCon
- Page 90 and 91: Chicago, IllinoisSpringfield, Illin
- Page 92 and 93: Cedar Rapids, Iowa City, IowaDavenp
- Page 94 and 95: Wichita, KansasLexington, KentuckyC
- Page 96 and 97: Monroe, LouisianaNew Orleans, Louis
- Page 98 and 99: Suburban MarylandBoston, Massachuse
- Page 100 and 101: Grand Rapids, MichiganLansing, Mich
- Page 102 and 103: St. Louis, MissouriBozeman, Montana
- Page 104 and 105: Omaha, NebraskaLas Vegas, NevadaCon
- Page 106 and 107: Portsmouth, New HampshireAtlantic C
- Page 108 and 109: Ocean/Monmouth Counties (“Shore M
- Page 110 and 111: Las Cruces, New MexicoAlbany, New Y
- Page 112 and 113: Asheville, North CarolinaCharlotte,
- Page 114 and 115: Fargo, North DakotaAkron, OhioConta
- Page 116 and 117: Cleveland, OhioColumbus, OhioContac
- Page 118 and 119: Tulsa, OklahomaPortland, OregonCont
- Page 120 and 121: Bucks County, PennsylvaniaHarrisbur
- Page 122 and 123: Pittsburgh, PennsylvaniaSchuylkill
- Page 124 and 125: Greenville/Spartanburg/Anderson Cou
- Page 128 and 129: Beaumont, TexasCorpus Christi, Texa
- Page 130 and 131: Fort Worth, TexasHouston, TexasCont
- Page 132 and 133: Texarkana (Bowie County, Texas/Mill
- Page 134 and 135: Northern VirginiaSeattle/Puget Soun
- Page 136 and 137: Madison, WisconsinMilwaukee, Wiscon
- Page 138 and 139: Jackson Hole, WyomingContactNAI Jac
- Page 140: Build on the power of our network.N