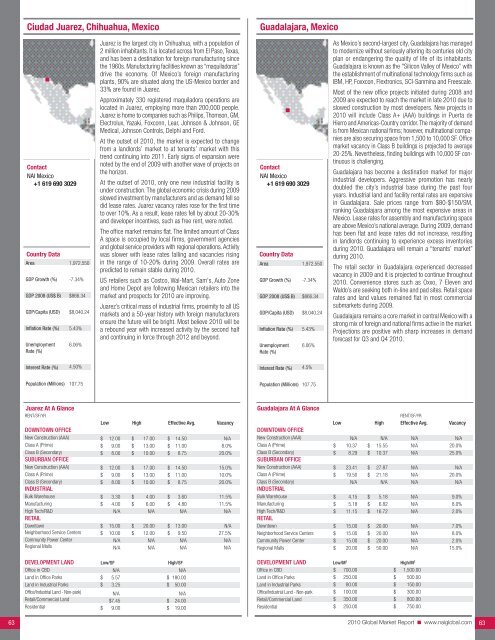
Ciudad Juarez, Chihuahua, MexicoGuadalajara, MexicoContact<strong>NAI</strong> Mexico+1 619 690 3029Country DataAreaGDP Growth (%)GDP 2008 (US$ B)GDP/Capita (USD)Inflation Rate (%)UnemploymentRate (%)1,972,550-7.34%$866.34$8,040.245.43%6.06%Juarez is the largest city in Chihuahua, with a population of2 million inhabitants. It is located across from El Paso, Texas,and has been a destination for foreign manufacturing sincethe 1960s. Manufacturing facilities known as “maquiladoras”drive the economy. Of Mexico’s foreign manufacturingplants, 90% are situated along the US-Mexico border and33% are found in Juarez.Approximately 330 registered maquiladora operations arelocated in Juarez, employing more than 200,000 people.Juarez is home to companies such as Philips, Thomson, GM,Electrolux, Yazaki, Foxconn, Lear, Johnson & Johnson, GEMedical, Johnson Controls, Delphi and Ford.At the outset of <strong>2010</strong>, the market is expected to changefrom a landlords’ market to at tenants’ market with thistrend continuing into 2011. Early signs of expansion werenoted by the end of 2009 with another wave of projects onthe horizon.At the outset of <strong>2010</strong>, only one new industrial facility isunder construction. The global economic crisis during 2009slowed investment by manufacturers and as demand fell sodid lease rates. Juarez vacancy rates rose for the first timeto over 10%. As a result, lease rates fell by about 20-30%and developer incentives, such as free rent, were noted.The office market remains flat. The limited amount of ClassA space is occupied by local firms, government agenciesand global service providers with regional operations. Activitywas slower with lease rates falling and vacancies risingin the range of 10-20% during 2009. Overall rates arepredicted to remain stable during <strong>2010</strong>.US retailers such as Costco, Wal-Mart, Sam's, Auto Zoneand Home Depot are following Mexican retailers into themarket and prospects for <strong>2010</strong> are improving.Juarez’s critical mass of industrial firms, proximity to all USmarkets and a 50-year history with foreign manufacturersensure the future will be bright. Most believe <strong>2010</strong> will bea rebound year with increased activity by the second halfand continuing in force through 2012 and beyond.Contact<strong>NAI</strong> Mexico+1 619 690 3029Country DataAreaGDP Growth (%)GDP 2008 (US$ B)GDP/Capita (USD)Inflation Rate (%)UnemploymentRate (%)1,972,550-7.34%$866.34$8,040.245.43%6.06%As Mexico’s second-largest city, Guadalajara has managedto modernize without seriously altering its centuries old cityplan or endangering the quality of life of its inhabitants.Guadalajara is known as the "Silicon Valley of Mexico” withthe establishment of multinational technology firms such asIBM, HP, Foxxcon, Flextronics, SCI-Sanmina and Freescale.Most of the new office projects initiated during 2008 and2009 are expected to reach the market in late <strong>2010</strong> due toslowed construction by most developers. New projects in<strong>2010</strong> will include Class A+ (AAA) buildings in Puerta deHierro and Americas-Country corridor. The majority of demandis from Mexican national firms; however, multinational companiesare also securing space from 1,500 to 10,000 SF. Officemarket vacancy in Class B buildings is projected to average20-25%. Nevertheless, finding buildings with 10,000 SF continuousis challenging.Guadalajara has become a destination market for majorindustrial developers. Aggressive promotion has nearlydoubled the city’s industrial base during the past fouryears. Industrial land and facility rental rates are expensivein Guadalajara. Sale prices range from $80-$150/SM,ranking Guadalajara among the most expensive areas inMexico. Lease rates for assembly and manufacturing spaceare above Mexico’s national average. During 2009, demandhas been flat and lease rates did not increase, resultingin landlords continuing to experience excess inventoriesduring <strong>2010</strong>. Guadalajara will remain a “tenants’ market”during <strong>2010</strong>.The retail sector in Guadalajara experienced decreasedvacancy in 2009 and it is projected to continue throughout<strong>2010</strong>. Convenience stores such as Oxxo, 7 Eleven andWaldo’s are seeking both in-line and pad sites. Retail spacerates and land values remained flat in most commercialsubmarkets during 2009.Guadalajara remains a core market in central Mexico with astrong mix of foreign and national firms active in the market.Projections are positive with sharp increases in demandforecast for Q3 and Q4 <strong>2010</strong>.Interest Rate (%)4.50%Interest Rate (%)4.5%Population (Millions)107.75Population (Millions)107.75Juarez At A GlanceRENT/SF/YRDOWNTOWN OFFICENew Construction (AAA)Class A (Prime)Class B (Secondary)SUBURBAN OFFICENew Construction (AAA)Class A (Prime)Class B (Secondary)INDUSTRIALBulk WarehouseManufacturingHigh Tech/R&DRETAILDowntownNeighborhood Service CentersCommunity Power CenterRegional MallsLow High Effective Avg. Vacancy$ 12.00 $ 17.00 $ 14.50 N/A$ 9.00 $ 13.00 $ 11.00 8.0%$ 8.00 $ 10.00 $ 8.75 20.0%$ 12.00 $ 17.00 $ 14.50 15.0%$ 9.00 $ 13.00 $ 11.00 10.0%$ 8.00 $ 10.00 $ 8.75 20.0%$ 3.30 $ 4.00 $ 3.60 11.5%$ 4.00 $ 6.00 $ 4.80 11.5%N/A N/A N/A N/A$ 15.00 $ 20.00 $ 13.00 N/A$ 10.00 $ 12.00 $ 9.50 27.5%N/A N/A N/A N/AN/A N/A N/A N/AGuadalajara At A GlanceDOWNTOWN OFFICENew Construction (AAA)Class A (Prime)Class B (Secondary)SUBURBAN OFFICENew Construction (AAA)Class A (Prime)Class B (Secondary)INDUSTRIALBulk WarehouseManufacturingHigh Tech/R&DRETAILDowntownNeighborhood Service CentersCommunity Power CenterRegional MallsRENT/SF/YRLow High Effective Avg. VacancyN/A N/A N/A N/A$ 10.37 $ 15.55 N/A 20.0%$ 8.29 $ 10.37 N/A 25.0%$ 23.41 $ 27.87 N/A N/A$ 19.50 $ 21.18 N/A 20.0%N/A N/A N/A N/A$ 4.15 $ 5.18 N/A 9.0%$ 5.18 $ 6.82 N/A 8.0%$ 11.15 $ 16.72 N/A 2.0%$ 15.00 $ 20.00 N/A 7.0%$ 15.00 $ 20.00 N/A 8.0%$ 15.00 $ 20.00 N/A 2.0%$ 20.00 $ 50.00 N/A 15.0%DEVELOPMENT LAND Low/SF High/SFOffice in CBDN/AN/ALand in Office Parks$ 5.57 $ 180.00Land in Industrial ParksOffice/Industrial Land - Non-park)Retail/<strong>Commercial</strong> LandResidential$$3.25N/A$7.459.00$$$50.00N/A24.0019.00DEVELOPMENT LAND Low/M 2 High/M 2Office in CBDLand in Office ParksLand in Industrial ParksOffice/Industrial Land - Non-parkRetail/<strong>Commercial</strong> LandResidential$$$$$$700.00250.0080.00100.00350.00250.00$$$$$$1,500.00500.00150.00300.00800.00750.0063 <strong>2010</strong> <strong>Global</strong> <strong>Market</strong> <strong>Report</strong> ■ www.naiglobal.com 63
Guanajuato, Guanajuato, MexicoContact<strong>NAI</strong> Mexico+1 619 690 3029Country DataAreaGDP Growth (%)GDP 2008 (US$ B)GDP/Capita (USD)Inflation Rate (%)UnemploymentRate (%)Interest Rate (%)1,972,550-7.34%$866.34$8,040.245.43%6.06%4.5%Population (Millions) 107.75Guanajuato At A GlanceDOWNTOWN OFFICENew Construction (AAA)Class A (Prime)Class B (Secondary)SUBURBAN OFFICENew Construction (AAA)Class A (Prime)Class B (Secondary)INDUSTRIALBulk WarehouseManufacturingHigh Tech/R&DRETAILDowntownNeighborhood Service CentersCommunity Power CenterRegional MallsThe city of Guanajuato has approximately 5 million inhabitantsand is located in the area of Mexico known as “ElBajio.” Guanajuato is centrally located in Mexico with fiveneighboring states: Jalisco to the west, San Luis Potosi andZacatecas to the south, Queretaro to the east and Michoacanto the north.Guanajuato is at the crossroads of two major industrialcorridors: Highway 45 (The Pan American Highway)and Highway 57 (the NAFTA Highway), which links SouthAmerica, Mexico and North America. Multimodal capabilitiesare available in several locations. Guanajuato also hosts theonly intersection of the Kansas City and Ferromex railroadsin Mexico. Major corporations based in Guanajuato includeGM, American Axle, Colgate Palmolive, Flex-n Gate, Fiberweb,Avon, Faurecia, Hino Motors, Getrag Ford, Flexi and Hella.Completed transactions during 2009 included Hino Motors(Automotive), Samot (Metal Mecanic) and Teco Westinghouse(Power Solutions), all of them build-to-suit projects.Vacancy rates during 2009 decreased from 10.14% to9.8% as a result of the lease of “Pisa Company” and “TLG”in Castro Del Rio Industrial Park and the delivery of 247,572SF of build-to-suit projects in Santa Fe Industrial Park.Guanajuato’s office market is small and most space iscomposed of low rise, garden office type projects that hostMexican local firms and global service providers. Lease ratesand land values are steady and not projected to rise during<strong>2010</strong>.The retail sector consists of large multi-tenant shoppingcenters located in middle and low income areas such asPlaza El Suez. Lease rates and land value are expected toremain stable through <strong>2010</strong>.Guanajuato’s unique central location in Mexico and itsposition at the crossroads of the nation’s two largest raillines and highways position it to become a major tradecorridor into North America for many years to come.RENT/SF/YRLow High Effective Avg. VacancyN/A N/A N/A N/A$ 9.60 $ 12.86 $ 11.23 12.0%$ 4.40 $ 8.76 $ 6.58 12.0%N/A N/A N/A N/A$ 7.48 $ 14.57 $ 11.02 4.0%$ 4.33 $ 8.68 $ 6.50 4.0%$ 3.48 $ 4.40 $ 3.94 9.8%$ 4.35 $ 4.70 $ 4.52 9.8%N/A N/A N/A N/A$ 13.50 $ 24.25 $ 18.87 N/A$ 15.90 $ 27.50 $ 21.70 N/AN/A N/A N/A N/A$ 15.50 $ 33.37 $ 24.43 N/ADEVELOPMENT LAND Low/M 2 High/M 2Office in CBDLand in Office ParksLand in Industrial ParksOffice/Industrial Land - Non-parkRetail/<strong>Commercial</strong> LandResidential$$$$N/AN/A25.0022.00100.00150.00$$$$N/AN/A37.0033.00300.00500.00Mexico City, MexicoContact<strong>NAI</strong> Mexico+1 619 690 3029Country DataAreaGDP Growth (%)GDP 2008 (US$ B)GDP/Capita (USD)Inflation Rate (%)UnemploymentRate (%)Interest Rate (%)1,972,550-7.34%$866.34$8,040.245.43%6.06%4.5%Population (Millions) 107.75Mexico City At A GlanceRENT/M 2 /MOUS$ RENT/SF/YRLow High Low High VacancyDOWNTOWN OFFICENew Construction (AAA)Class A (Prime)$$24.0018.00$$40.0024.00$ 26.76$ 20.07$ 44.59$ 26.7610.0%20.0%Class B (Secondary)SUBURBAN OFFICE$ 8.00 $ 15.00 $ 8.92 $ 16.72 35.0%New Construction (AAA)Class A (Prime)Class B (Secondary)INDUSTRIAL$$$20.0015.0010.00$$$25.0020.0016.00$ 22.30$ 16.72$ 11.15$ 27.87$ 22.30$ 17.8430.0%35.0%25.0%Bulk WarehouseManufacturingHigh Tech/R&DRETAIL$$$4.004.005.00$$$6.007.007.00$$$4.464.465.57$$$6.697.807.8016.0%15.0%20.0%Downtown (High Street Shops)Neighborhood Service CentersCommunity Power Center (Big Box)Regional MallsSolus Food Stores$$$$12.0018.0025.0035.00N/A$$$$50.0026.0040.0040.00N/A$ 13.38$ 20.07$ 27.87$ 39.02N/A$ 55.74$ 28.99$ 44.59$ 44.59N/A15.0%20.0%12.0%20.0%N/ADEVELOPMENT LAND Low/ M 2 High/M 2 Low/SF High/SFOffice in CBDLand in Office ParksLand in Industrial ParksOffice/Industrial Land - Non-parkRetail/<strong>Commercial</strong> LandResidentialMexico City, the capital of Mexico, is located in South-CentralMexico and has over 23 million inhabitants. Mexico Cityis often seen as the first stop for foreign investors interestedin development, industrial, retail and office investments. In2008, Mexico joined the group of top 12 economies in theworld ($1 trillion GDP), maintains an investment grade ratingand is the eighth largest world exporter.Mexico City is host to major corporate headquarters from avariety of global sectors. National firms with headquarters inMexico City include Grupo Modelo, Grupo Carso, Telmex,DESC, GICSA and BIMBO. Automotive firms include GM,Ford, Volkswagen, Nissan, Honda and Chrysler. Most multinationalslike Coca Cola, Pepsi, Honeywell, Siemens,Motorola, USG, IBM, HP, Samsung, Sony, INTEL, LG, P&Gand Wal-Mart maintain headquarters in Mexico City.Mexico City and Toluca encompass more than 17 millionSM of industrial land. At the end of 2009, the largestvacancy among the main industrial submarkets in theMexico City metro area was registered in Cuautitlan with20% of the total industrial inventory. Recent developmentsinclude Tlalnepantla, Toluca-Lerma and now Huehuetoca.Lease rates and land values have not fallen and areexpected to remain unchanged during <strong>2010</strong>.The retail sector cooled rapidly during 2009 althoughAmway, Wal-Mart, Costco, Home Depot, Best Buy and otherbig box retailers experienced some growth, even under thenegative economic conditions. However, the rate of expansionfor these retailers decreased across the board.Investors are now looking for stand-alone sites, strip centersand anchored retail centers for <strong>2010</strong>.Office market vacancies were under 10% in 2009 due tohigh demand from the number of companies seeking officespace and limited inventory due to the lack of new buildingson the market. New construction projected for late 2009has been delayed and only those buildings with over 80%completion are being finalized. Lease rates are running from$24-$40/SM per month. In general, the Mexico City officemarket remains strong and a constant demand for productpromises a robust market for <strong>2010</strong>.Mexico City will continue to be a first stop for foreign investors.Its critical mass, domestic market demand and positionas a place for Latin American regional headquartersensure continued growth and a positive forecast for <strong>2010</strong>and beyond. Mexico City will remain a global destination forboth corporate users and investors for many years to come.$ 1,280.00 $ 3,000.00 $ 118.91 $ 278.71$ 408.00 $ 878.00 $ 37.90 $ 81.57$ 60.00 $ 243.00 $ 5.57 $ 22.58$ 100.00 $ 325.00 $ 9.29 $ 30.19$ 215.00 $ 690.00 $ 19.97 $ 64.10$ 265.00 $ 560.00 $ 24.62 $ 52.03<strong>2010</strong> <strong>Global</strong> <strong>Market</strong> <strong>Report</strong> ■ www.naiglobal.com 64
- Page 1 and 2:
CommercialCommercial Real Estate Se
- Page 3 and 4:
■ ■ ■ Table of ContentsGENERA
- Page 5 and 6:
Global OutlookCommercial real estat
- Page 7 and 8:
38.3% in November 2009. At the same
- Page 9 and 10:
quality than the Census properties.
- Page 11 and 12:
SaskatchewanSaskatchewan is a small
- Page 13 and 14: As 2009 draws to a close, there is
- Page 15 and 16: Global investment interest largely
- Page 18 and 19: ChinaChina continued to post large
- Page 20 and 21: MalaysiaWith Malaysia’s dependenc
- Page 22 and 23: ■ US Highlights - Northeast Regio
- Page 24 and 25: ■ US Highlights - Midwest Region
- Page 26 and 27: ■ US Highlights - West Region■
- Page 28 and 29: Melbourne, AustraliaBeijing, ChinaC
- Page 30 and 31: Shanghai, ChinaXiamen, ChinaContact
- Page 32 and 33: Delhi, Gurgaon, IndiaHyderabad, Pra
- Page 34 and 35: Punjab, IndiaTokyo, JapanContactNAI
- Page 36 and 37: Seoul, South KoreaTaipei, TaiwanCon
- Page 38 and 39: Calgary, Alberta, CanadaEdmonton, A
- Page 40 and 41: Halifax, Nova Scotia, CanadaOttawa,
- Page 42 and 43: Regina, Saskatchewan, CanadaContact
- Page 44 and 45: Vienna, AustriaThe Baltics (Latvia/
- Page 46 and 47: Copenhagen, DenmarkFinlandContactNA
- Page 48 and 49: Athens, GreeceReykjavik IcelandCont
- Page 50 and 51: KuwaitOslo, NorwayContactNAI Kuwait
- Page 52 and 53: Moscow, Russian FederationSt. Peter
- Page 54 and 55: Madrid, SpainStockholm, SwedenConta
- Page 56 and 57: Istanbul, TurkeyKiev, UkraineContac
- Page 58 and 59: Latin AmericaSECTION CONTENTSBuenos
- Page 60 and 61: Campinas, BrazilCuritiba, BrazilCon
- Page 62 and 63: Sao Paulo, BrazilSantiago, ChileCon
- Page 66 and 67: Matamoros, Tamaulipas, MexicoMexica
- Page 68 and 69: Reynosa, MexicoSaltillo, Coahuila,
- Page 70 and 71: Torreon, Coahulia, MexicoCaracas, V
- Page 72 and 73: Birmingham, AlabamaHuntsville, Deca
- Page 74 and 75: Jonesboro, ArkansasLittle Rock, Ark
- Page 76 and 77: Marin County, CaliforniaMonterey, C
- Page 78 and 79: Sacramento, CaliforniaSan Diego, Ca
- Page 80 and 81: Santa Clara County (Silicon Valley)
- Page 82 and 83: Colorado Springs, ColoradoDenver, C
- Page 84 and 85: Fort Lauderdale, FloridaFt. Myers/N
- Page 86 and 87: Miami, FloridaOrlando, FloridaConta
- Page 88 and 89: Atlanta, GeorgiaHonolulu, HawaiiCon
- Page 90 and 91: Chicago, IllinoisSpringfield, Illin
- Page 92 and 93: Cedar Rapids, Iowa City, IowaDavenp
- Page 94 and 95: Wichita, KansasLexington, KentuckyC
- Page 96 and 97: Monroe, LouisianaNew Orleans, Louis
- Page 98 and 99: Suburban MarylandBoston, Massachuse
- Page 100 and 101: Grand Rapids, MichiganLansing, Mich
- Page 102 and 103: St. Louis, MissouriBozeman, Montana
- Page 104 and 105: Omaha, NebraskaLas Vegas, NevadaCon
- Page 106 and 107: Portsmouth, New HampshireAtlantic C
- Page 108 and 109: Ocean/Monmouth Counties (“Shore M
- Page 110 and 111: Las Cruces, New MexicoAlbany, New Y
- Page 112 and 113: Asheville, North CarolinaCharlotte,
- Page 114 and 115:
Fargo, North DakotaAkron, OhioConta
- Page 116 and 117:
Cleveland, OhioColumbus, OhioContac
- Page 118 and 119:
Tulsa, OklahomaPortland, OregonCont
- Page 120 and 121:
Bucks County, PennsylvaniaHarrisbur
- Page 122 and 123:
Pittsburgh, PennsylvaniaSchuylkill
- Page 124 and 125:
Greenville/Spartanburg/Anderson Cou
- Page 126 and 127:
Knoxville, TennesseeMemphis, Tennes
- Page 128 and 129:
Beaumont, TexasCorpus Christi, Texa
- Page 130 and 131:
Fort Worth, TexasHouston, TexasCont
- Page 132 and 133:
Texarkana (Bowie County, Texas/Mill
- Page 134 and 135:
Northern VirginiaSeattle/Puget Soun
- Page 136 and 137:
Madison, WisconsinMilwaukee, Wiscon
- Page 138 and 139:
Jackson Hole, WyomingContactNAI Jac
- Page 140:
Build on the power of our network.N


